7 Referral Metrics To Track ROI
Measure the right referral KPIs—conversion, participation, CAC, CLV and NPS—to prove and improve the ROI of your referral program.

Justin Britten

Referral programs can lower customer acquisition costs (CAC) and drive growth by leveraging your existing customers. But without tracking the right metrics, it’s hard to measure success or improve performance. Here are the seven key metrics you need to monitor to ensure your referral program delivers measurable ROI:
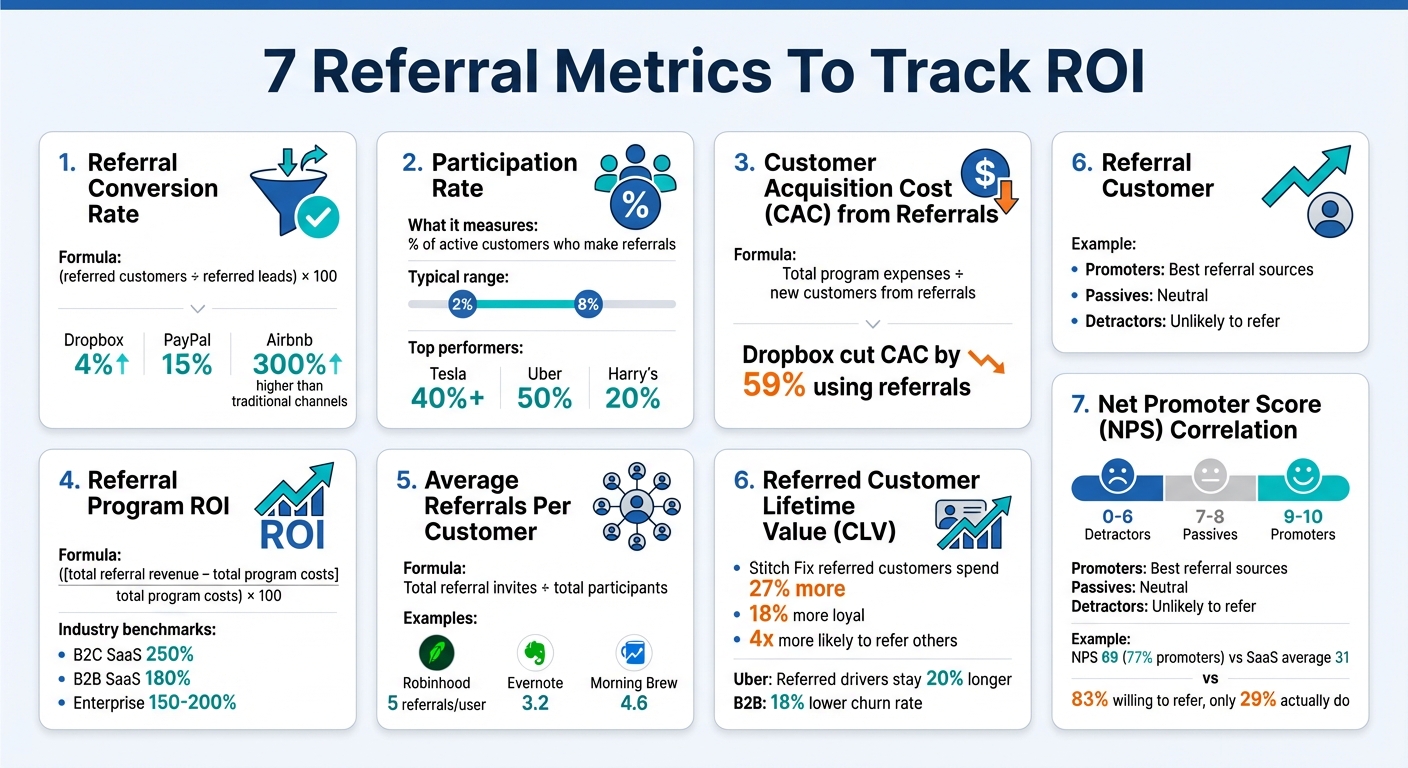
- Referral Conversion Rate: Tracks how many referred leads become paying customers. High conversion rates indicate strong trust and program effectiveness.
- Participation Rate: Measures what percentage of your customers actively refer others. Low rates may signal poor visibility or unappealing rewards.
- Customer Acquisition Cost (CAC) from Referrals: Calculates how much you spend to acquire a customer through referrals. Compare this to paid channels to assess cost-efficiency.
- Referral Program ROI: Shows the revenue generated for every dollar spent on the program. A high ROI justifies scaling your referral efforts.
- Average Referrals Per Customer: Indicates how frequently participants share your product. Identifying top referrers can amplify your reach.
- Referred Customer Lifetime Value (CLV): Measures the long-term revenue from referred customers, who often spend more and remain loyal longer.
- Net Promoter Score (NPS) Correlation with Referrals: Links customer satisfaction to referral likelihood, helping you focus on your most enthusiastic brand advocates.
7 Essential Referral Metrics to Track ROI
1. Referral Conversion Rate
Referral conversion rate = (referred customers ÷ referred leads) × 100. This metric helps you understand whether your referral program is actually turning leads into paying customers. In other words, it’s a direct indicator of how well your program contributes to revenue.
Impact on ROI Measurement
This metric is a clear marker of your program's financial impact. Without conversions, metrics like shares or clicks don’t mean much. For instance, Dropbox’s two-sided incentive program achieved a 4% referral conversion rate, while PayPal experienced conversion rates as high as 15% during its rapid growth phase. Airbnb’s referral program also outperformed traditional marketing channels, delivering 300% higher conversion rates.
"Referral Conversion Rate is arguably the most crucial referral program metric... it directly reflects the ROI of your referral program." - Refgrow
By analyzing this metric, you can compare how referrals perform against other marketing channels and better allocate your resources.
Ease of Tracking and Calculation
Tracking referral conversions accurately depends on having strong attribution systems in place. Tools like unique referral codes, UTM parameters, and session tracking are essential for linking conversions back to the original referrer, even if the purchase happens later. For real-time tracking, integrate referral data into your CRM, marketing automation tools, or billing platforms like Stripe. Proper attribution ensures you can confidently measure each referral’s ROI.
Actionable Insights for Optimization
Once you’ve nailed down your conversion rates, focus on fixing any weak points. If shares are high but conversions are low, your messaging or incentives might need adjustment. Break down conversion rates by referral source or customer segment to pinpoint which advocates bring in the best leads. Also, streamline your signup process - keep it under 30 seconds and optimize for mobile, where 65% of referrals take place.
2. Participation Rate
Participation rate is a key metric to gauge the early-stage health of your referral program. It measures the percentage of active customers who engage with the program. To calculate it, divide the number of customers who’ve made at least one referral by your total active customer base, then multiply by 100. Typically, participation rates fall between 2% and 8% of active customers.
Impact on ROI Measurement
This metric acts as an early signal of how well your program is performing. It shows whether your customers are aware of the program and find the incentives appealing. A low participation rate could point to issues like poor visibility or incentives that don’t resonate. For example, Tesla managed to exceed a 40% participation rate by tailoring its program to its passionate customer base, while Uber hit rates as high as 50% in certain markets by offering aggressive, localized incentives.
Ease of Tracking and Calculation
Calculating participation rate is simple, but precision is crucial. Track active users carefully and segment the data by factors like customer tenure, subscription tier, or acquisition channel. This segmentation helps identify your most engaged advocates and provides a clearer picture of where adjustments might be needed.
Actionable Insights for Optimization
If your participation rate is underperforming, focus on improving visibility. Add calls-to-action (CTAs) to high-traffic spots like post-purchase pages, website headers, or email newsletters. A great example comes from Harry’s, a grooming brand that hit a 20% participation rate during their pre-launch by strategically implementing referral mechanics. To drive further engagement, consider automated reminders for customers who’ve signed up but haven’t referred anyone yet. Experiment with rewards too - try tiered bonuses or gamified leaderboards to spark more interest and participation.
3. Customer Acquisition Cost from Referrals
After understanding conversion and participation rates, the next key metric to assess is the Customer Acquisition Cost (CAC) from referrals. This measures how much it costs to acquire a new customer through your referral program. To calculate it, divide your total program expenses - such as incentives, platform fees, and operational costs - by the number of new customers gained via referrals.
Impact on ROI Measurement
Referral CAC is a crucial indicator of ROI, especially when compared to traditional paid channels. For instance, Dropbox managed to cut its CAC by 59% by prioritizing referrals over paid advertising. With the rising costs of paid advertising, referrals present a more budget-friendly option. However, accuracy is essential - focus on counting incremental customers (those who wouldn’t have purchased without the referral) rather than every referred lead. This avoids overstating ROI. To highlight the program’s efficiency, compare referral CAC to the costs of channels like Google Ads or Facebook Ads. This can help justify scaling your referral efforts.
Ease of Tracking and Calculation
Tracking referral CAC requires capturing all associated costs, including:
- Rewards: Cash payouts, gift cards, or discounts.
- Platform Fees: Costs for referral software or tools.
- Marketing Spend: Expenses tied to promoting the referral program.
- Operational Overheads: Staff time, fraud prevention tools, and other administrative costs.
To ensure accurate attribution, use unique referral links and integrate your CRM system. This prevents errors like under-counting or double-counting customers. Fraud prevention is also critical - tools like velocity limits and duplicate detection can help monitor for incentive abuse, which might otherwise inflate your CAC.
Actionable Insights for Optimization
Focus your referral efforts on high-value customers. Data shows that customers who engage with your product 3–4 times a week are four times more likely to generate successful referrals. Regularly review your cost structure - if reward expenses or platform fees are eating into your margins, consider adjusting your incentives. Performance-based rewards, which only pay out after a conversion, can be a smart alternative.
Platforms like Prefinery offer advanced analytics and fraud detection, making it easier to maintain clean data and optimize spending without constant manual intervention. These tools can help you refine and optimize your referral program to ensure your strategy remains both effective and cost-efficient.
4. Referral Program ROI
Referral Program ROI combines key metrics like Conversion Rate and CAC to give a comprehensive look at how financially effective your referral program is.
Understanding ROI Measurement
The formula for Referral Program ROI is:
([total referral revenue – total program costs] / total program costs) × 100
This calculation shows how much revenue you earn for every dollar spent on your referral program. For instance, B2C SaaS companies typically report an ROI close to 250%, while B2B SaaS averages around 180%. Enterprise businesses usually see returns between 150% and 200%. These numbers often make a compelling case for reallocating budgets from paid advertising to referral strategies.
Simplifying Tracking and Calculations
Accurate ROI tracking depends heavily on reliable attribution systems, as previously discussed.
To find your break-even point, divide the total program cost by the net value of each referral (average referral value minus reward cost). For example, if your monthly program cost is $5,000 and each referral generates $100 in value after subtracting a $20 reward, you’d need about 63 referrals to break even. Any referrals beyond this point contribute directly to your profit.
Once you have precise tracking in place, you can use the data to evaluate and refine your program’s performance.
Insights for Better Performance
Having clear ROI data allows you to make strategic adjustments that improve results. Consider these actionable steps:
- Conduct quarterly ROI audits to identify potential issues early.
- Analyze which customer groups deliver the best returns.
- Use tiered rewards to motivate high-performing advocates.
- Personalize follow-up communications through CRM data, which can boost conversion rates by up to 23%.
Tools like Prefinery streamline this process. Prefinery offers built-in analytics to track ROI automatically, pinpoint top-performing advocates, and provide a user-friendly dashboard to see exactly where your referral investments are going - and how much they’re earning in return.
5. Average Referrals Per Customer
Tracking average referrals per customer is a smart way to gauge the reach and effectiveness of your referral program. This metric builds on conversion and cost data, offering a look at how well your program spreads through customer sharing. It’s a key indicator of your program’s viral potential and overall ROI. Using a viral marketing tool can help you maximize this reach.
Impact on ROI Measurement
The average referrals per customer metric shows how often participants share your product with others. It’s calculated by dividing the total number of referral invites sent by the total number of participants. This approach helps normalize referral activity, even as your customer base expands.
Spotting "super-referrers" is crucial. These are customers who drive multiple sign-ups, and their impact can be massive. For instance, Robinhood’s waitlist campaign achieved an impressive average of 5 referrals per user by using exclusivity and a queue-jumping incentive. Similarly, Evernote’s points-based system led to an average of 3.2 referrals per active referrer. Morning Brew tapped into community-building, with premium subscribers referring an average of 4.6 friends each. On the flip side, a low average could signal that your incentives aren’t strong enough to encourage ongoing sharing. In such cases, tiered rewards might help increase ROI per participant.
Ease of Tracking and Calculation
Modern tools make tracking this metric straightforward. Referral platforms can integrate with your CRM, automatically attributing referrals to specific customers. Platforms like Prefinery provide real-time dashboards that highlight top advocates and their referral counts. This automation replaces manual spreadsheets, giving you instant insights into who your super-sharers are. With this data, you can quickly adjust strategies and even recruit these advocates as brand ambassadors.
Actionable Insights for Optimization
Engaging your customers through visible referral data can boost participation. For example, displaying referral history in customer dashboards encourages ongoing sharing. Study the behaviors of your top referrers to replicate their success across your customer base. Adding gamified elements, like leaderboards or contests with prizes, can also spark friendly competition and drive more referrals. Growth-stage companies often see participation rates of 25–35% with optimized landing pages, and offering dual-sided rewards can push those rates up by as much as 68%.
6. Referred Customer Lifetime Value
Referred Customer Lifetime Value (CLV) is a key metric that measures the total revenue brought in by customers who were acquired through referrals. By keeping an eye on this metric, you can gain a clearer picture of how your referral program contributes to long-term revenue growth.
Impact on ROI Measurement
Referred customers often outperform those acquired through other channels. For example, Stitch Fix reports that referred customers spend 27% more in their first year. Similarly, Uber found that referred drivers stayed active on the platform 20% longer than non-referred drivers, boosting their overall value.
This trend holds true across various industries. Referred customers generally shop more frequently, place larger orders, and remain loyal to brands for longer periods. On top of that, they’re 18% more loyal and are four times more likely to refer others, creating a ripple effect that amplifies the returns on your referral program. For B2B companies, the advantages are even more pronounced, with referred customers showing an 18% lower churn rate.
Ease of Tracking and Calculation
Once you understand the revenue impact of referred customers, calculating their CLV becomes essential for refining your strategy. To determine referred CLV, multiply the average order value by the annual purchase frequency and customer lifespan, then subtract the acquisition cost. Since customer behavior and subscription models can shift over time, it’s important to update this data regularly.
Automating this process can save time and improve accuracy. By integrating referral software with your CRM, you can track referred CLV consistently and without hassle. Tools like Prefinery offer built-in analytics to segment referred customers automatically, making it easier to compare their performance against other acquisition channels.
Actionable Insights for Optimization
Segmenting referred CLV from your overall customer base provides a clearer understanding of how your referral program is performing. Regularly analyze this data to fine-tune your referral strategies. As you gather more insights, adjust your projections and refine your approach to maximize the effectiveness of future campaigns. This targeted focus ensures your referral program continues to deliver strong results.
7. Net Promoter Score Correlation with Referrals
Net Promoter Score (NPS) measures customer satisfaction and helps predict how likely your customers are to recommend your product. It’s a valuable tool for identifying potential advocates and optimizing your referral strategy.
Impact on ROI Measurement
NPS acts as a reliable signal for the success of referral programs. Customers who score 9-10, known as "Promoters", are your best bet for generating referrals. On the flip side, those scoring 0-6, called "Detractors", are unlikely to refer others.
"NPS is a leading indicator of future growth. The larger the number of advocates for a product, the lower the customer acquisition costs for the company." - Talkable
For example, Canva boasts an NPS of 69, with 77% of its users falling into the Promoter category. Meanwhile, the SaaS industry average sits at just 31. This stark difference illustrates why some companies thrive on referral-driven growth, while others face challenges. Implementing a viral pre-launch waiting list can help build this momentum early by identifying and rewarding your most enthusiastic promoters.
Ease of Tracking and Calculation
Tracking NPS is simple and can be seamlessly tied to referral activity. After key customer interactions, survey users and group their responses into three categories: Promoters (9-10), Passives (7-8), and Detractors (0-6). To calculate your NPS, subtract the percentage of Detractors from the percentage of Promoters.
While 83% of customers say they’re willing to refer a product after a positive experience, only 29% actually follow through. This gap underscores the importance of timing - capitalize on high NPS scores by asking for referrals when customers are most satisfied.
Actionable Insights for Optimization
Focus your referral efforts on Promoters to maximize results. At the same time, pay close attention to feedback from Detractors to identify and address issues. Resolving these problems not only improves your NPS but also strengthens your referral program’s overall performance.
How to Track and Optimize Referral Metrics
Tracking referral metrics accurately and optimizing them is essential for ensuring a measurable return on investment (ROI). Start by implementing tracking tools like unique referral codes, UTM parameters, and cookie-based session tracking. These methods ensure proper attribution, even when there's a delay between the referral and the final sign-up.
To get a clearer picture, integrate your referral data with your CRM. Tools like Prefinery make this easier by offering no-code integration with popular analytics and CRM platforms. This integration provides a complete view of your referral program’s performance, helping you refine your strategy.
It's important to monitor the entire referral funnel to spot where potential customers drop off. This means tracking every stage - from the initial share and click-through to sign-up, purchase, and retention. For instance, if people are sharing your referral links often but few clicks are happening, your messaging might need tweaking. On the other hand, if click-through rates are strong but sign-ups are low, it could point to issues with your landing page.
To measure the true impact of your referral program, calculate incremental lift using methods like holdout testing or cohort matching. This helps differentiate customers acquired through referrals from those who would have converted anyway. Don’t forget to track indirect benefits, such as increased brand searches or the positive effects of social proof, which can amplify your other marketing efforts.
Once bottlenecks are identified, focus on testing and improving incentives. Conduct A/B tests to see what works best for your audience - whether it’s double-sided vs. single-sided rewards, cash vs. credit, or tiered vs. flat rewards. With 65% of referrals happening on mobile devices, make sure your tracking systems work seamlessly across all platforms. Finally, set up regular reporting schedules - weekly or monthly - to identify trends early and make adjustments before minor issues escalate into major problems.
Conclusion
Tracking referral metrics transforms your referral program into a measurable growth tool with real ROI. As acquisition costs continue to rise, referral marketing stands out as one of the most cost-efficient strategies for SaaS companies and startups.
Metrics like conversion rates and customer lifetime value are key to understanding your program's performance. These seven metrics help you uncover strengths, identify problem areas, and improve profitability. For example, integrating referral data with your CRM can boost conversion rates by 23% through personalized follow-ups. Additionally, customers who successfully refer others tend to increase their own engagement and loyalty by 15%, amplifying your growth over time. These insights pave the way for immediate improvements to your referral program.
Lay the groundwork for accurate tracking by using tools like unique referral codes, UTM parameters, and cookie tracking. Start by focusing on metrics like Participation Rate, Conversion Rate, and ROI before diving into more detailed data. This ensures you avoid information overload while still gaining actionable insights.
Your tracking systems should work seamlessly across all platforms. Focus on customers who use your product 3–4 times a week - they are four times more likely to make successful referrals. Also, ensure your signup process is quick and straightforward, ideally taking less than 30 seconds, to encourage participation.
For those looking for a tailored solution, Prefinery offers customizable, no-code integration with detailed analytics to help SaaS and fintech startups streamline their referral programs and achieve consistent growth.
With the right tools and metrics in place, you can turn satisfied customers into a powerful engine for growth.
FAQs
What are the best ways to boost my referral conversion rate?
To improve your referral conversion rate, focus on keeping the process easy, engaging, and rewarding. Offer rewards that genuinely appeal to your audience, and make sure the referral process is straightforward - especially on mobile devices, where many users are likely to engage. Timing plays a big role too. Well-timed reminders or sharing success stories can inspire users to take action.
Keep an eye on key metrics like share rate, click-through rate, and conversion rate to spot areas that need adjustment. A/B testing can be a game-changer here - experiment with different rewards, messaging approaches, or referral prompts to see what resonates most. By fine-tuning your strategy and using tools that offer detailed analytics and smooth integration, you can boost conversions and turn referrals into loyal, long-term customers.
How can I accurately track Customer Acquisition Cost (CAC) from referrals?
To measure Customer Acquisition Cost (CAC) from referrals accurately, start by defining what counts as a referral. Make sure to include every related expense - think software fees, marketing campaigns, and the time your team spends managing the referral program. Once you’ve got the total cost, divide it by the number of new customers gained through referrals. That’s your referral-specific CAC.
It’s also important to keep an eye on metrics like the referral success rate, conversion rate, and the lifetime value (LTV) of referred customers. These numbers give you a clearer picture of how well your referral program is performing. Regular reviews of these metrics can highlight areas to tweak, like modifying rewards or fine-tuning strategies to improve ROI. Tools such as Prefinery can make this process easier by automating tracking and providing detailed analytics, saving you time and ensuring precise data.
Why is Net Promoter Score (NPS) crucial for referral programs?
Net Promoter Score (NPS) plays a key role in the success of referral programs because it measures how satisfied and loyal your customers are. When customers feel genuinely happy with your product or service, they’re much more likely to recommend it to others - creating a natural boost for your referral campaigns.
Tracking NPS helps you gauge customer engagement and spot areas where the customer experience could be improved. A higher NPS often leads to stronger word-of-mouth recommendations, which can significantly enhance the return on investment (ROI) of your referral efforts. Prioritizing customer satisfaction is a smart way to ensure your referral program fuels steady, organic growth.