How Cohort Analysis Boosts Referral Campaigns
Use cohort analysis to compare referral sources, spot high-value channels, detect churn early, and optimize rewards to boost retention and lifetime value.

Justin Britten

Cohort analysis is a powerful way to improve referral campaigns by focusing on user behavior over time instead of just raw signup numbers. It helps identify which referral sources bring in users who stick around and generate revenue versus those who churn quickly. By grouping users based on traits like signup date or referral channel, you can uncover patterns in retention, engagement, and customer lifetime value (CLV).
Key benefits include:
- Spotting high-performing referral channels: Focus your budget on sources that drive loyal, high-value users.
- Detecting churn early: Use heatmaps to identify where users drop off and address issues proactively.
- optimizing referral rewards: Test incentives to find what drives better retention and conversions.
For example, businesses like Ahrefs and History Hit used cohort analysis to refine their strategies, improving retention and profitability. Looking at SaaS referral program examples can provide further inspiration for your own cohort-based optimizations. This data-driven approach ensures referral campaigns are not just about quantity but quality - bringing in users who stay and contribute to long-term growth.
What Is Cohort Analysis?
Cohort analysis is a method in behavioral analytics that groups users based on shared traits - like when they signed up, how they were acquired, or their referral source - and tracks their actions over time. Instead of lumping all users together, it breaks them into smaller, more specific segments, offering a clearer picture of how each group behaves throughout their journey.
For referral campaigns, this approach is incredibly useful. It allows you to compare referred users directly with those from other channels, such as paid ads or organic search, to measure their long-term value. Christoph Janz, Partner at Point Nine Capital, emphasizes its importance:
It's almost impossible to get a really good understanding of a service's usage without looking at activity and retention numbers on a cohort-by-cohort basis.
The focus here is on tracking long-term engagement rather than simply counting new signups. It’s about understanding whether referred users are sticking around or leaving quickly. This insight helps you evaluate the quality of your referral sources and identify potential issues early. Let’s dive into how cohort analysis is used to track referral behavior.
How Cohort Analysis Tracks Referral Behavior
Cohort analysis helps uncover patterns in retention, referral activity, and engagement among referred users. There are two primary types of cohorts to consider: acquisition cohorts and behavioral cohorts.
- Acquisition cohorts group users by when they joined or their referral source. This allows you to measure retention over time and compare the quality of different referral and affiliate acquisition channels.
- Behavioral cohorts group users based on their actions, such as referring a friend or using a specific feature. This helps you understand what behaviors drive engagement and retention.
Take History Hit’s Black Friday promotion as an example. In November 2019, the subscription video service slashed its acquisition costs in half with deep discounts. But cohort analysis revealed that these discounts attracted less committed users. The cancellation rate spiked from 6% to 9%, monthly lifetime value dropped by 36%, and trial conversions fell from 80% to 40%. While the promotion boosted signups, it brought in lower-quality leads who didn’t stick around. The same principle applies to referral campaigns - offering overly generous incentives might inflate numbers but harm retention.
Similarly, Ahrefs used cohort analysis to refine their trial strategy. They noticed that their 14-day free trial attracted "serial signups" - users who canceled and re-registered with new emails. By switching to a 7-day trial for $7, they saw fewer trials overall but achieved a higher trial-to-paid conversion rate and better resource allocation for their support team.
Key Metrics to Track in Referral Cohorts
To effectively analyze referral cohorts, focus on these key metrics:
- Retention Rate: This measures the percentage of referred users who remain active after a set period, like 30, 90, or 180 days. It’s a strong indicator of whether referred users stick around longer than those from other channels. A high retention rate suggests that your referral source is bringing in engaged, valuable users.
- Referral Rate: This tracks the percentage of users in a cohort who go on to refer others. It’s a great way to identify which groups are most likely to spread the word about your product. If users from a specific channel have high referral rates, it might be worth investing more in that source.
- Customer Lifetime Value (CLV): This metric calculates the total revenue generated by a referred cohort over their entire relationship with your product. It helps you assess the ROI of your referral incentives and determine how much you can afford to spend on rewards while staying profitable.
- Churn Time: This shows how long, on average, it takes for referred users to cancel or disengage. Knowing this allows you to time re-engagement efforts effectively. For example, if referred users tend to drop off around month three, you can plan targeted check-ins or offers just before that point.
These metrics provide the insights needed to fine-tune your referral campaigns. As Jonathan Parisot, Co-founder and CEO of Actiondesk, explains:
Cohort analysis can help you determine which cohorts/groups of customers are contributing the most to revenue.
How Cohort Analysis Improves Referral Campaigns
Cohort analysis takes the guesswork out of referral campaigns by offering clear insights into which channels bring in engaged, revenue-generating users. Its real power lies in comparing the quality of users from different sources. For example, one referral channel might generate fewer signups but deliver customers who spend more and stick around longer. Cohort tables help uncover these patterns by tracking user behavior over time, showing exactly where to focus your energy. For fast-growing brands, a well-tuned referral program can account for 5% to 15% of all new customer acquisitions.
Below, we’ll explore how to identify the best referral channels, reduce churn, and fine-tune rewards using cohort analysis.
Find Your Best Referral Channels
Not every referral source delivers the same results. Take this example: a shopping app’s cohort analysis revealed that while the US contributed 80% of 14,000 re-engaged users, smaller groups from Canada drove higher revenue.
To pinpoint your top-performing channels, define cohorts by referral source - like "Referrals-Email-Jan" versus "Referrals-SMS-Jan" - and compare their 30-, 60-, and 90-day retention rates. Social media might bring in a flood of impulse referrals with high churn, whereas email referrals from loyal advocates could yield 25x ROI and stronger long-term retention. Tracking the lifetime value (LTV) of users from each channel is also essential to understanding the true return on investment, beyond just acquisition costs.
Here’s another example: a hyper-casual gaming company analyzed two media sources for user acquisition. Media Source 1 spent $88,594 to acquire 586,000 users but ended up operating at a loss. Meanwhile, Media Source 2, which brought in fewer installs, broke even by Day 12 and proved far more profitable. Insights like these allow you to cut underperforming channels and double down on what works.
By isolating your most effective channels, you can boost both retention and revenue.
Detect Churn Early and Improve Retention
Cohort heat maps can act like an early warning system for churn. Their patterns reveal different issues: vertical stripes suggest universal events (like onboarding updates), horizontal stripes highlight problems within specific cohorts, diagonal stripes indicate global trends, and outlier blocks point to temporary disruptions.
A sharp drop in retention during the first one to three months often signals deeper issues, like mismatched user expectations, a flawed onboarding process, or low-quality leads brought in through aggressive discounts. Crystal Widjaja, EIR and Program Partner at Reforge, underscores the importance of acting quickly:
Re-engaging churned users is a more challenging effort than addressing waning usage issues in real-time.
To prevent churn from spiraling, use your cohort data to schedule proactive re-engagement. For instance, if drop-offs occur around month three, you could send automated check-in emails or in-app messages during months one and two to address potential friction points.
Test and Refine Referral Rewards
Cohort analysis is also a powerful tool for experimenting with referral incentives. You can group users based on the rewards they received - like a $10 credit versus a 20% discount - and compare their behavior over several months.
| Metric | Ideal Range | Optimization Strategy |
|---|---|---|
| Share Rate | 5% - 9% | Increase Advocate incentive if the rate is low |
| Clicks per Share | 1.8 - 2.8 | Improve Friend incentive or tweak share copy |
| Conversion Rate | 2-3x Ecommerce Rate | A/B test Friend incentives or use dedicated landing pages |
For instance, if your share rate is underperforming, consider testing a higher Advocate reward. If clicks are low, try adjusting the Friend incentive. The ultimate goal is to strike a balance - attracting users who stick around and generate revenue, rather than focusing solely on boosting signups.
Platforms like Prefinery can simplify this process by providing detailed analytics on cohort performance. By identifying which incentives lead to the highest retention and LTV, you can fine-tune your referral program to maximize ROI while keeping acquisition costs in check.
How to Run Cohort Analysis for Referral Campaigns
5-Step Cohort Analysis Process for Referral Campaigns
Cohort analysis doesn't require advanced technical skills, and it can be broken down into five simple steps. These steps help you figure out which referral strategies are working and which ones might be wasting your budget.
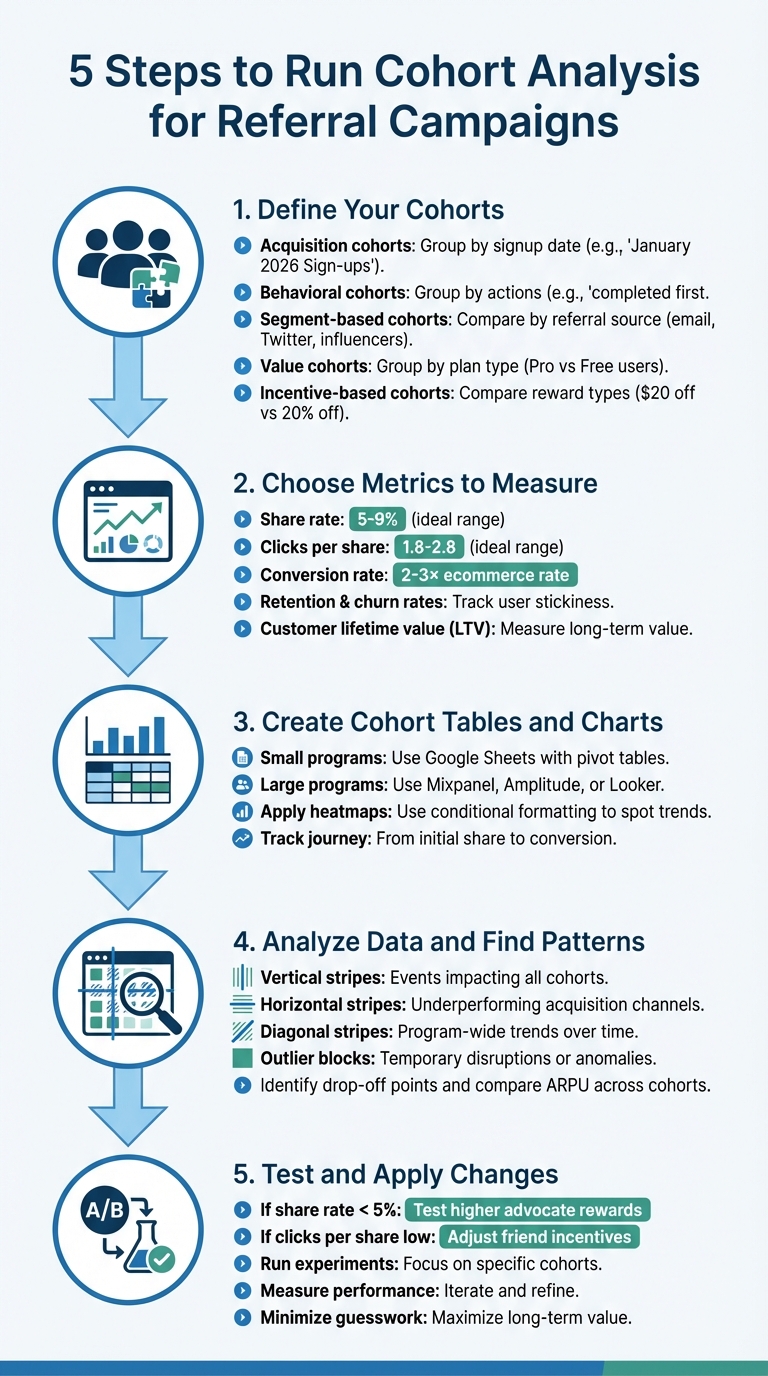
Step 1: Define Your Cohorts
Start by grouping users based on shared characteristics. For example:
- Acquisition cohorts group users by when they joined, like "January 2026 Sign-ups", to track behavior over time.
- Behavioral cohorts focus on specific actions, such as "completed first referral" or "shared link on social media".
Netflix, for instance, studied viewing patterns to pinpoint the "Hooked Episode" for their shows. They found that users who reached Episode 3 of House of Cards were far less likely to cancel their subscriptions. This insight led them to improve features like auto-play and recommendations.
Other cohort types include:
- Segment-based cohorts: Compare users by referral source (e.g., email, Twitter, or influencers) to evaluate user quality.
- Value cohorts: Group customers by plan type, such as "Referred Pro Users" versus "Referred Free Users", to see which group delivers the highest lifetime value.
- Incentive-based cohorts: Compare users who received different rewards, like "$20 off" versus "20% off", to determine which offer drives better retention.
Here’s a quick overview:
| Cohort Type | Referral Application | Key Metric |
|---|---|---|
| Acquisition Date | Users who joined during a holiday campaign | Retention Rate |
| Media Source | Instagram referrals vs. email referrals | LTV / ARPU |
| Behavioral Trigger | Users who made 3+ referrals in their first month | Referral Velocity |
| Reward Type | $20 credit vs. 10% lifetime discount | Churn Rate |
Step 2: Choose Metrics to Measure
Pick metrics that reveal how your cohorts perform over time. Some key ones include:
- Share rate: Ideally, between 5% and 9%, this measures how many advocates share your referral program.
- Clicks per share: A range of 1.8 to 2.8 indicates how enticing your friend incentive is.
- Conversion rate: For referrals, this should be 2–3× higher than typical ecommerce rates.
Additionally, track retention and churn rates to compare how long referred users stay active versus users from other channels. If you notice high churn within the first two months, it might indicate a disconnect between your marketing promises and the actual product experience. Lastly, monitor customer lifetime value (LTV) to identify the referral channels or incentives that bring in the most valuable customers.
Once you've chosen your metrics, you can visualize the data using cohort tables and charts.
Step 3: Create Cohort Tables and Charts
For smaller programs, spreadsheets like Google Sheets work well. Use pivot tables to group "Customer Start Date" by "Year-Month" and apply heatmaps with conditional formatting.
For larger programs, automated tools are better. Platforms like Mixpanel or Amplitude can track behavioral cohorts, such as users who referred two or more friends. Referral-specific software simplifies tracking from the initial share to conversion, while BI tools like Looker or Sisense handle deeper revenue analysis for extensive datasets.
"One of the most important tools to better understand the usage of a web application... is a cohort analysis. In fact, it's almost impossible to get a really good understanding of a service's usage without looking at activity and retention numbers on a cohort-by-cohort basis."
- Christoph Janz, Partner, Point Nine
Once your tables and charts are ready, the next step is to dig into the patterns they reveal.
Step 4: Analyze the Data and Find Patterns
Look for patterns in your heatmaps:
- Vertical stripes: These show events that impact all cohorts at the same point in their journey, such as a reward expiration.
- Horizontal stripes: These highlight underperforming acquisition channels.
- Diagonal stripes: These point to trends affecting your entire program.
For example, a case study of History Hit's Black Friday promotion revealed that deep discounts attracted lower-quality leads.
Use your cohort tables to spot drop-off points. If users stop referring around months nine to eleven, consider sending check-in emails or re-engagement triggers a month earlier. Compare average revenue per user (ARPU) across cohorts to see if users from specific campaigns are more likely to upgrade.
Step 5: Test and Apply Changes
Use the insights from your analysis to run experiments. For example:
- If your share rate is below 5%, test higher rewards for advocates.
- If clicks per share are low, try new friend incentives or tweak your sharing messages.
Ahrefs, for instance, discovered that their 14-day free trial attracted "serial trialists" who repeatedly signed up with different emails. By switching to a $7 paid trial for seven days, they filtered out these users and boosted trial-to-paid conversions.
Tools like Prefinery make it easy to test different incentive structures. You can set up variations for specific cohorts, analyze their performance, and pinpoint which combinations of advocate and friend rewards work best. This approach minimizes guesswork, keeps acquisition costs in check, and maximizes long-term value.
These experiments provide actionable insights that help refine your referral strategy for consistent growth.
How to Use Cohort Insights to Improve Referral Campaigns
Cohort analysis offers a treasure trove of insights that can fine-tune your referral campaigns. By identifying patterns, you can take targeted actions to reduce churn, boost ROI, and scale your most effective referral channels.
Re-engage Low-Performing Cohorts
If your cohort analysis heatmaps show horizontal stripes indicating lower retention, you've found a group that needs immediate attention. The goal is to address their concerns before they churn.
For example, if users in a cohort typically lose interest around months 9–11, consider sending check-in emails or personalized offers as early as month 8. This proactive approach works far better than trying to win them back after they've already canceled.
"Re-engaging churned users is a more challenging effort than addressing waning usage issues in real-time." - Crystal Widjaja, EIR, Program Partner, Reforge
If the data shows a steep drop-off in the first month, cancellation surveys can uncover whether the product failed to meet the expectations set by the referral. Similarly, if certain regional or demographic cohorts underperform, you can implement localized strategies like offering special coupon codes or promotions tied to local holidays to rekindle interest.
Once you've addressed low-performing cohorts, it's time to double down on what works best.
Double Down on High-Performing Channels
Cohort analysis can reveal which referral sources not only bring in large numbers of users but also attract loyal, high-value customers. For instance, if users acquired through viral waitlists show better retention rates, it might make sense to allocate more resources to that channel using a viral marketing tool. Tools like Prefinery can automate viral waitlists, turning early adopters into advocates and generating up to 30% of new leads through referrals.
To make the most of your budget, compare the ROI of different campaigns. For example, if one referral channel breaks even by day 12 while another remains unprofitable by day 30, reallocating your spend could yield better results.
After identifying your strongest channels, focus on financially supporting the most promising user groups.
Allocate Budget to High-Value Cohorts
Not all referrals are equal, and cohort analysis helps identify the user groups that deliver the highest lifetime value. Use this data to refine your acquisition strategies.
Track ARPU (average revenue per user) by cohort to identify the most lucrative channels. For instance, if Canadian users engage less frequently than Australians but generate significantly higher revenue, consider adjusting your ad spend to prioritize the Canadian market. Pay close attention to CAC (customer acquisition cost) payback times to determine where to increase investments.
"Cohort analysis is the only way to actually get a true return on marketing investment number." - Barilliance
Conclusion
Cohort analysis is a game-changer for refining SaaS referral strategies. Instead of focusing on surface-level metrics like total signups, this approach digs deeper - showing exactly when referred users drop off, which channels bring in high-value customers, and how to separate meaningful leads from those just looking for quick deals.
By comparing acquisition sources side by side, cohort analysis helps prioritize quality over sheer numbers. For instance, if data reveals that users from a specific cohort tend to churn around month four, you can step in earlier - perhaps during month three - with targeted retention efforts. Likewise, if a particular referral channel consistently brings in loyal, upgrading customers, you can reallocate your budget to amplify those results.
What makes this process even more effective is the integration of tools that streamline the analysis. Platforms like Prefinery simplify referral tracking and provide detailed analytics, all without the need for manual effort. With features like no-code integration and customizable rewards, you can fine-tune campaigns effortlessly. Using tools like these enables SaaS startups to act on cohort insights swiftly - accelerating launches, making smarter growth decisions, and creating referral programs that drive long-term revenue.
FAQs
What makes cohort analysis more effective than traditional analytics for referral campaigns?
Cohort analysis dives deeper than just looking at overall numbers. It groups referred users by shared characteristics - like their sign-up date - and tracks how each group behaves over time. This method reveals trends in user retention and engagement that standard analytics, which typically focus on totals like sign-ups or active users, might overlook.
By examining how various cohorts perform, you can adjust your referral campaigns to address specific behaviors, tweak rewards, and build stronger, long-term user loyalty. Tools like Prefinery take this process a step further by offering detailed analytics and customizable referral systems, making it easier for SaaS startups to grow strategically and efficiently.
What are the key metrics to track for measuring the success of referral cohorts?
To gauge how well referral cohorts are performing, it’s essential to track metrics that shed light on both growth and efficiency. Here are some key metrics to keep an eye on:
- Viral coefficient (K-factor): This measures how many additional users each referred user brings in, giving you a sense of the program's ripple effect.
- Referral conversion rate: Tracks the percentage of referred users who actually sign up or complete the desired action, like making a purchase.
- Referral-generated revenue: Shows how much income is directly tied to referrals, helping you measure the program's financial impact.
- Lifetime value (LTV) of referred customers: Looks at how profitable referred users are over time, offering insights into their long-term value.
- Program participation rates: Includes stats like how many users join the referral program and how many actively send out referrals.
- Cost per acquisition (CPA) or ROI per cohort: Helps you understand how cost-effective it is to gain new customers through referrals.
By diving into these metrics, SaaS startups can pinpoint which cohorts are delivering the most value, fine-tune their referral strategies, and get the best return on their efforts. Tools like Prefinery make this easier by providing detailed analytics and actionable insights, helping businesses adjust their approach and fuel consistent growth.
How can cohort analysis help improve referral marketing campaigns?
Cohort analysis allows businesses to group users based on shared traits, such as their signup date or referral source, and monitor their behavior over time. This method helps uncover retention trends, showing where users tend to drop off, comparing how different referral sources perform, and identifying patterns in both low-value and high-value churn. Common metrics include retention rates at intervals like 7, 30, or 90 days, as well as the viral growth rate of referred users.
Armed with these insights, you can take specific actions to improve user engagement. For example, enhancing the onboarding process, offering better referral rewards, or adding in-app nudges to address common user challenges. Tools like Prefinery simplify this process by linking referral campaigns to retention data, making it easy to see how changes - like adjusting reward structures - affect long-term engagement. With its customizable features and no-code integration, Prefinery enables SaaS startups to quickly test and refine their referral strategies to maintain steady growth.