
Predictive Analytics in SaaS Referral Programs
How SaaS teams use predictive models, clean tracking, and experiments to prioritize referral prompts and measure revenue impact.

Justin Britten
Referral activity is not the same as referral value. If I had to sum up this topic in one line, it would be this: the best SaaS referral programs use prediction to decide who to prompt, when to prompt them, what reward to show, and how much to spend.
Here’s the short version:
- Past referral data can help forecast future results, not just report clicks and signups
- Referred customers often perform better than non-referred customers in published studies
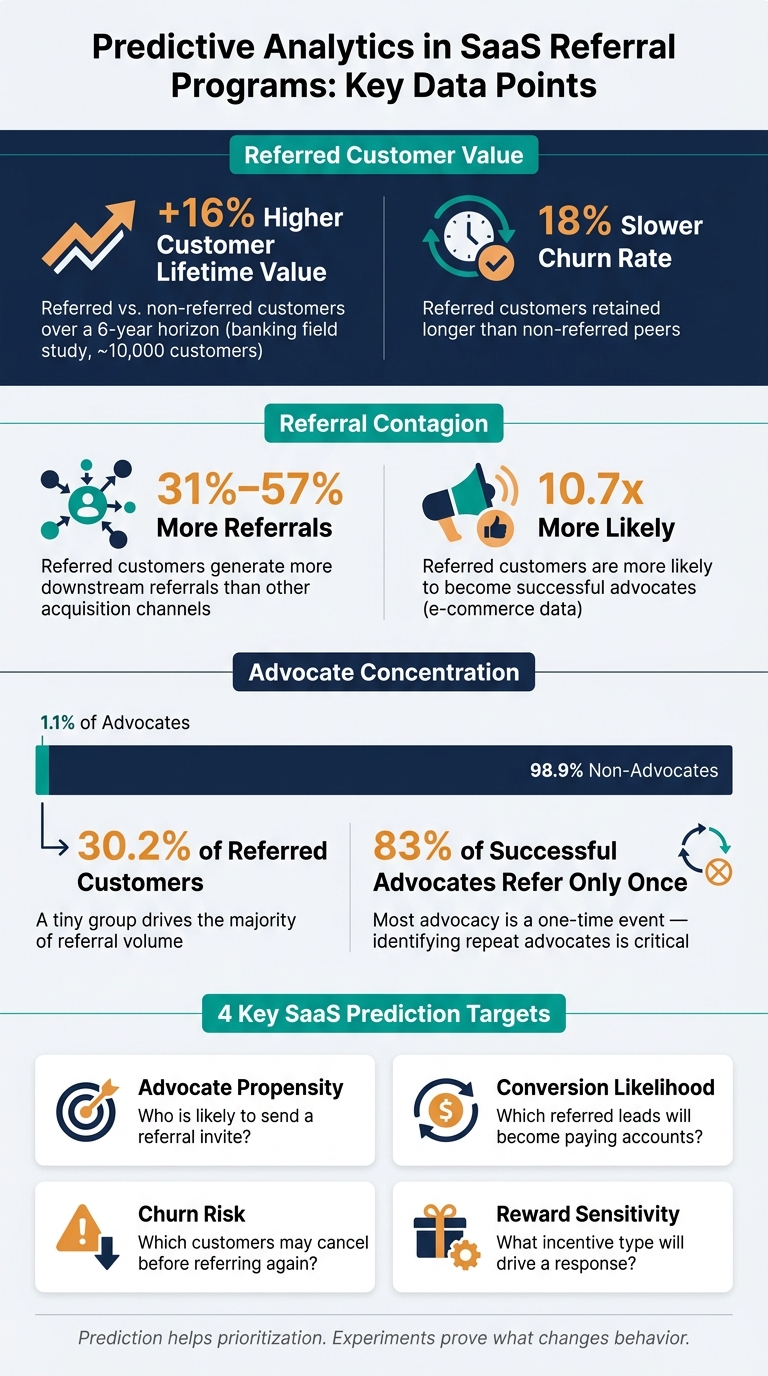
- One study of about 10,000 bank customers found referred users churned about 18% more slowly and had about 16% higher CLV
- Referred customers may also refer other people at higher rates, with studies showing 31% to 57% more referrals
- Referral impact is uneven: about 1.1% of advocates drove 30.2% of referred customers, while 83% of successful advocates referred only once
- For SaaS teams, the main prediction jobs are usually:
- Who is likely to refer
- Which referred leads are likely to convert
- Which customers may churn
- Which reward may get a response
- A score alone does not prove a prompt caused more referrals
- To measure cause, I need controlled tests with clean tracking
- Good referral analysis depends on:
- clear event data
- stable attribution rules
- fraud checks
- privacy controls
- links between referral data, CRM, billing, and product usage
The big takeaway is simple: prediction helps with prioritization, but experiments show what changed behavior. And if the data is messy, neither one helps much.
That’s the lens I’d use for the rest of this article: treat SaaS referral program examples and research as direction, build models around clear business decisions, and test every prompt or reward against revenue, retention, and churn - not just invite volume.
Referral Program Analytics: Key Stats & Prediction Targets for SaaS
What Research Says About Referral Customer Value
Published studies keep pointing in the same direction: referred customers tend to be worth more. That said, most of the evidence comes from banking and retail, not SaaS. So it makes sense to treat the numbers as directional signals, not as a plug-and-play forecast for your business.
Field Studies on Profitability, Retention, and Lifetime Value
One of the most-cited field studies followed about 10,000 bank customers over three years. It found that referred customers were more profitable, more loyal, and had higher lifetime value than similar non-referred customers.
That’s useful for SaaS teams, but only as a reference point. Banking and SaaS work differently. Churn patterns differ. Onboarding differs. Product usage differs. So the study helps set expectations, but it shouldn’t be treated like a direct projection.
Research on Referral Contagion and Repeat Advocacy
Referred customers also tend to bring in more people themselves. Across multiple field datasets, referred customers made 31% to 57% more referrals than customers from other acquisition channels. For SaaS, that matters a lot. The worth of a referred customer isn’t just their own spend or retention. It also includes the downstream referrals they may generate.
There’s another pattern that stands out: advocacy is very uneven. A tiny group does a huge share of the work. About 1.1% of advocates drive 30.2% of referred customers, and 83% of successful advocates refer only once.
That has a clear takeaway for SaaS teams: predicting who is likely to advocate should be a top modeling goal. These numbers can help you spot users who may be worth prompting. What they don’t tell you is which message, timing, or offer will actually change behavior.
| Industry | Sample / Dataset | Method | Main Outcome | SaaS Relevance |
|---|---|---|---|---|
| Banking | ~10,000 customers | 3-year tracking | Higher profitability, loyalty, and CLV | Low (transfer limits due to churn and onboarding differences) |
| Multi-sector | Multiple field datasets | Behavioral analysis | Referred customers make 31% to 57% more referrals | High (supports secondary referral value forecasting) |
| E-commerce | 500 Shopify stores | Store-level data | Referred customers are 10.7x more likely to become successful advocates | Closest fit for product-led SaaS |
What Transfers to SaaS
The safest way to use these findings is as directional input. They can help shape assumptions, expected ranges, and model design, but they are not SaaS benchmarks.
From here, the job is to turn these customer value patterns into prediction targets and model inputs.
Predictive Models SaaS Teams Use to Improve Referral Decisions
The tougher part isn’t building a model. It’s deciding which referral behavior to predict and which choice that prediction should guide. Data only matters if it changes a real decision. So the starting point isn’t the algorithm. It’s the decision you need to make.
Key Prediction Targets Across the Referral Funnel
Each stage in the referral funnel calls for a different prediction target. In most SaaS setups, referral models focus on advocate propensity, conversion likelihood, churn risk, or reward sensitivity. Each one lines up with a specific business choice.
| Model Target | What It Predicts | Key SaaS Inputs |
|---|---|---|
| Advocate Propensity | Probability a user sends an invite - users active 3–4 times per week are four times more likely to refer | Login frequency, NPS, feature adoption, tenure |
| Conversion Likelihood | Probability a lead becomes a paying account | Referral source, industry, initial engagement |
| Churn Risk | Probability of cancellation | Usage drops, support history, plan tier |
| Reward Sensitivity | Sensitivity to incentive type | Prior reward usage, account type (B2B vs. B2C) |
Put simply, these models answer different questions:
- Who is most likely to refer?
- Which referred leads are most likely to convert?
- Which customers may cancel before they ever refer again?
- What type of reward is most likely to get a response?
That kind of split matters. If your team mixes these targets together, you can end up with a score that sounds useful but doesn’t help anyone act.
Methods and Input Variables That Fit SaaS Data
Pick a model that fits the outcome, then keep inputs limited to data your team can track the same way over time. That sounds basic, but it saves a lot of pain later.
Most SaaS teams already have the raw material. Common inputs include feature use, plan tier, tenure, login frequency, NPS, support history, source, industry, and early engagement. These signals are often sitting in product analytics, CRM records, and support tools already.
When teams build these models, they should also document a few nuts-and-bolts details: the training window, the validation method, and how class imbalance was handled. Without that, model results can look better on paper than they do in practice.
It also helps to report precision, recall, AUC, and calibration. Those numbers tell you whether the model is fit for use or just interesting in a slide deck.
Why Prediction Does Not Prove Intervention Impact
This is where teams often trip up. A high propensity score does not prove your referral prompt caused someone to refer. It may just mean the model found users who were likely to refer on their own.
Cash and commission-based programs outperform coupon-only programs on revenue benchmarks. But that big-picture result still doesn’t answer a harder question: what will work best for your users? Credits, cash, or a tiered reward might all perform differently depending on the product, buyer, and account type.
Predictive scores help you decide whom to contact first. They do not tell you what will change behavior. To learn that, you need experiments and referral program best practices - not just prediction.
How SaaS Companies Test Interventions and Build Usable Data Pipelines
Once you know who is likely to refer, the next step is simple: test what actually changes behavior. Prediction tells you who might refer. Experiments tell you whether a prompt, reward, or message caused more people to act.
Experiment Designs for Referral Prompts and Rewards
Each referral test needs a clear setup from the start. That means one hypothesis, one control condition, and one metric tied to business value. If the test setup gets muddy, the readout usually does too.
Here’s a simple way to map interventions:
| Intervention | Primary Hypothesis | Control Condition | Success Metric | Main Risk |
|---|---|---|---|---|
| Double-sided Rewards | Rewarding both parties increases social ease and participation. | Single-sided reward (referrer only). | Participation Rate | Higher acquisition cost. |
| In-Product Modals | Prompting during active use increases relevance. | Email-only referral prompts. | Invitation Rate | UX disruption. |
| Tiered Milestones | Gamification and increasing value drive repeat advocacy. | Flat reward for every referral. | Average Referrals per User | Complexity in reward fulfillment. |
| Urgency-based Copy | Limited-time offers trigger faster decisions. | Evergreen/generic referral copy. | Click-through Rate (CTR) | Brand fatigue or perceived "spamminess." |
| NPS-Triggered Prompts | Satisfied users are more likely to provide high-quality leads. | Randomly timed referral prompts. | Referral Success Rate | Too few eligible referrers. |
It’s also worth tracking the full path from invite to churn. A test can look great at the top of the funnel and still fall apart later. More clicks are nice. Paid users who stick around are better.
Minimum Data and Attribution Rules for Reliable Analysis
Clean data makes or breaks this work. At a minimum, your pipeline should include timestamped events for referrer and referred user IDs across invite, click, signup, activation, payment, reward, refund, churn, and usage.
Your attribution model should match how your funnel works. A simple consumer signup flow may need one setup. A longer B2B journey may need another.
| Attribution Model | Best For | Description |
|---|---|---|
| First-touch | Discovery | Credits the first interaction; identifies how users find the product. |
| Last-touch | Conversion | Credits the final interaction; ideal for immediate signups. |
| Linear | Full Journey | Distributes credit equally across all touchpoints. |
| W-shaped | Complex B2B | Credits key milestones: discovery, lead creation, opportunity. |
| Server-side | Privacy | Tracks referrals without cookies; survives cookie loss. |
Attribution only helps if the data is collected and stored under clear governance rules. If event logs are patchy, delayed, or inconsistent, the model may look neat on paper but still point you in the wrong direction.
Privacy and Governance Requirements for U.S. SaaS Teams
Privacy rules in the U.S. change by state, but the day-to-day playbook is pretty straightforward. Collect only the data your model needs. Document retention periods and access controls. Honor deletion and opt-out requests.
When building propensity models, stay away from sensitive attributes like race, gender, and health status. The same goes for variables that can stand in for them. Zip code or job title may seem harmless at first glance, but both can carry demographic bias. That creates legal risk and can lead to unfair outcomes.
This is one of those areas where discipline matters. These tests only work when the event pipeline is consistent and audit-ready.
What SaaS Teams Need to Run and Measure a Referral Program
What to Look for in Referral Infrastructure
Once prediction and testing are set, the next piece is infrastructure that records every referral event.
That means tracking the entire event trail: invite, click, signup, activation, payment, reward, retention, expansion, and cancellation.
Three things matter most:
- Identity resolution should connect anonymous clicks to verified signups and paying accounts. In B2B SaaS, that often means matching at the account level, not just the user level.
- Reward eligibility should be tied to a real milestone, like email verification, activation, or payment.
- Fraud checks need to be in place before launch, including self-referrals, duplicate accounts, disposable emails, and odd velocity patterns.
On the reporting side, don't stop at top-of-funnel conversion. You want cohort-level views that compare referred and non-referred users on activation, retention, and revenue. That's where the story gets more interesting.
Referral data should also sync with your CRM, billing system, product analytics tool, and warehouse. Then reconcile conversions on a regular basis. If referral data sits in its own silo, cohort analysis gets messy fast.
For U.S. SaaS teams, privacy needs to be built into the stack from day one. Disclose tracking, keep data collection tight, set retention rules, limit access, and support deletion or correction requests.
Where Prefinery Fits in a Research-Based Referral Stack
Once the data pipeline is in place, the next step is choosing a platform that can capture the data cleanly.
For prelaunch SaaS and fintech teams, Prefinery works well as the operational layer for a referral waitlist. It supports referral links, configurable rewards like early access or discounts, customizable waitlist forms, referral and share tracking, channel conversion reporting, email analytics, and no-code setup.
That extra control matters. Compared with template-based tools, Prefinery gives teams more room to shape waitlist forms and tiered referral goals. It’s also built to handle traffic spikes, which matters during launch windows when referral volume can swing fast.
It helps to think of Prefinery as referral-program infrastructure and a data source, not a predictive analytics engine.
It captures referral events and participant data that can feed analysis in your CRM, product analytics platform, or data warehouse. The modeling work - figuring out who is most likely to advocate, estimating conversion probability, and projecting LTV by cohort - happens downstream using the data Prefinery helps collect.
Conclusion: What the Evidence Supports Today
The research points in a fairly clear direction: referred customers often show stronger downstream value than non-referred customers. Academic work suggests a 16% higher customer lifetime value over a six-year horizon.
That said, the figure comes from a financial-services setting. It does not automatically carry over to self-serve SaaS, enterprise products, or prelaunch waitlists. Treat it as directional, not as a promise.
Predictive models can help teams prioritize likely advocates or shape rewards with more care. But prediction by itself doesn't show that a prompt or reward caused extra growth. Only controlled experiments can do that.
And this is where many teams trip up: data quality, clean attribution rules, and steady governance are not side issues. They’re the backbone of any referral analysis you can trust. The strongest programs combine research, experiments, and dependable infrastructure.
FAQs
How much data do I need to predict referrals reliably?
Focus on statistical significance, not random volume. If you're A/B testing referral messaging, aim for at least 1,000 users per variation so random swings don't skew the result.
Timing matters too. User behavior shifts throughout the week, so run each test for at least one full week to catch both weekday and weekend patterns.
If you need close tracking while the test is live, Prefinery’s granular, real-time analytics can help you measure these metrics with accuracy.
Which referral metric matters most for SaaS growth?
Referral ROI is the metric that matters most. Skip vanity numbers like total shares or clicks. What you want to measure is the full revenue impact:
((Net Referral Revenue - Program Costs) / Program Costs) × 100
To calculate it the right way, track CLV and retention rates alongside acquisition costs. Prefinery helps teams go beyond basic tracking with deeper analytics, so they can fine-tune these numbers and get a clearer view of what the program is actually producing.
How do I tell prediction from real lift?
Look past top-line totals and track how people behave over time with cohort analysis. It gives you a cleaner read on what’s changing and when. Predictive analytics can estimate future results from past data, but actual lift only shows up when you compare referred cohorts against non-referred baselines.
If referred customers keep showing higher lifetime value and lower churn than non-referred groups, that’s a strong sign the program is driving results. Prefinery helps with the detailed, automated tracking needed to separate those variables.