Real-Time Data Visualization for Referral Campaigns
Live dashboards for referral campaigns reveal shares, reach, and conversions so you can fix issues, cut waste, and scale what's working.

Justin Britten
Referral campaigns can waste money if you don’t know what’s working. With customer acquisition costs up nearly 60% in five years, tracking performance in real time is no longer optional. Real-time dashboards help SaaS teams make smarter decisions by showing shares, reach, and conversions as they happen.
Here’s why this matters:
- Fix issues fast: Spot and address problems like low conversions or high costs instantly.
- Boost ROI: Focus on the best-performing channels and advocates to maximize results.
- Catch viral trends: Act immediately when a campaign gains momentum.
- Save money: Avoid overspending on ineffective strategies.
Key metrics to monitor include:
- Shares & Reach: Early indicators of campaign success.
- Cost per Referral: Ensure acquisition costs stay under control.
- Conversion Rates by Channel: Tailor messaging to specific audiences.
Automated systems and tools like Prefinery simplify this process, integrating data directly into dashboards and ensuring accuracy. The result? A clear, actionable strategy that helps you adjust campaigns in real time and improve referral performance.
Why Real-Time Data Visualization Matters for Referral Campaigns
Real-time dashboards are a game-changer for your growth strategy. Instead of waiting weeks to analyze what worked, you get instant insights into whether your referral campaign is thriving or falling flat. Every dollar wasted on ineffective tactics hits your bottom line, which is why tracking early indicators like shares and reach is so important.
By focusing on these leading metrics, you can shift from reactive to proactive decision-making. Modern dashboards allow you to monitor upstream data - like shares and reach - rather than just waiting for final conversion numbers. This forward-looking approach helps you identify problems and opportunities early. For instance, automated real-time attribution systems improve revenue tracking accuracy by 84%, which leads to 57% higher conversion rates and 73% better engagement.
Track Campaign Performance as It Happens
Live dashboards let you see exactly which channels - social media, email, or blogs - are driving traffic right now. For example, if 30% of referral shares are coming from email, you know where to focus your optimization efforts. Real-time tracking also highlights your most influential supporters while they’re actively promoting your product. Instead of finding out weeks later that a specific influencer or website drove significant traffic, you can nurture those relationships and tweak incentives while the momentum is still strong.
These instant insights allow you to adjust campaigns on the fly, improving performance while keeping costs under control.
Adjust Campaigns Faster and Control Costs
Real-time A/B testing lets you optimize incentives much faster. Forget month-long experiments - you can test reward structures like "$40 credit" versus "Give $20, Get $20" and pivot to the most effective option within days. If conversion rates drop or costs per referral rise, you can fix the issue immediately, avoiding unnecessary overspending.
This approach simplifies decision-making with "if X, do Y" logic. For example, if reach is low, tweak your share messaging or rewards. If shares are high but conversions are lagging, improve your landing page experience. Dashboards pinpoint exactly where you need to act, and automation eliminates the manual work that often slows down adjustments.
Catch Viral Moments Before They Pass
Viral trends don’t wait for your weekly analytics review. Real-time data lets you act on unexpected spikes as they happen. If a particular message or channel suddenly takes off, you can amplify its impact right away - whether that means increasing ad spend, updating your messaging, or reaching out to key advocates.
Prefinery makes this process seamless by integrating these insights directly into its dashboards. You can see shares, reach, and conversions in one place, without switching between tools. This means you can identify a viral moment during your morning coffee and take action before lunch, instead of missing the opportunity entirely.
Which Metrics to Monitor in Real-Time Referral Dashboards
Real-Time Referral Campaign Metrics: Key Performance Benchmarks and ROI Statistics
When using real-time referral dashboards, it’s crucial to focus on metrics that give you a clear picture of your campaign’s trajectory. Instead of waiting for final conversion numbers, keep an eye on early indicators like Shares (how many advocates are sharing) and Reach (how many clicks those shared links generate). These metrics act as early warning signs, helping you understand whether your campaign is on the right track.
For example, if shares are high but reach is low, it could mean your messaging isn’t resonating. On the flip side, high reach with low conversions might point to issues with your landing page.
Referral Conversion Rates by Channel
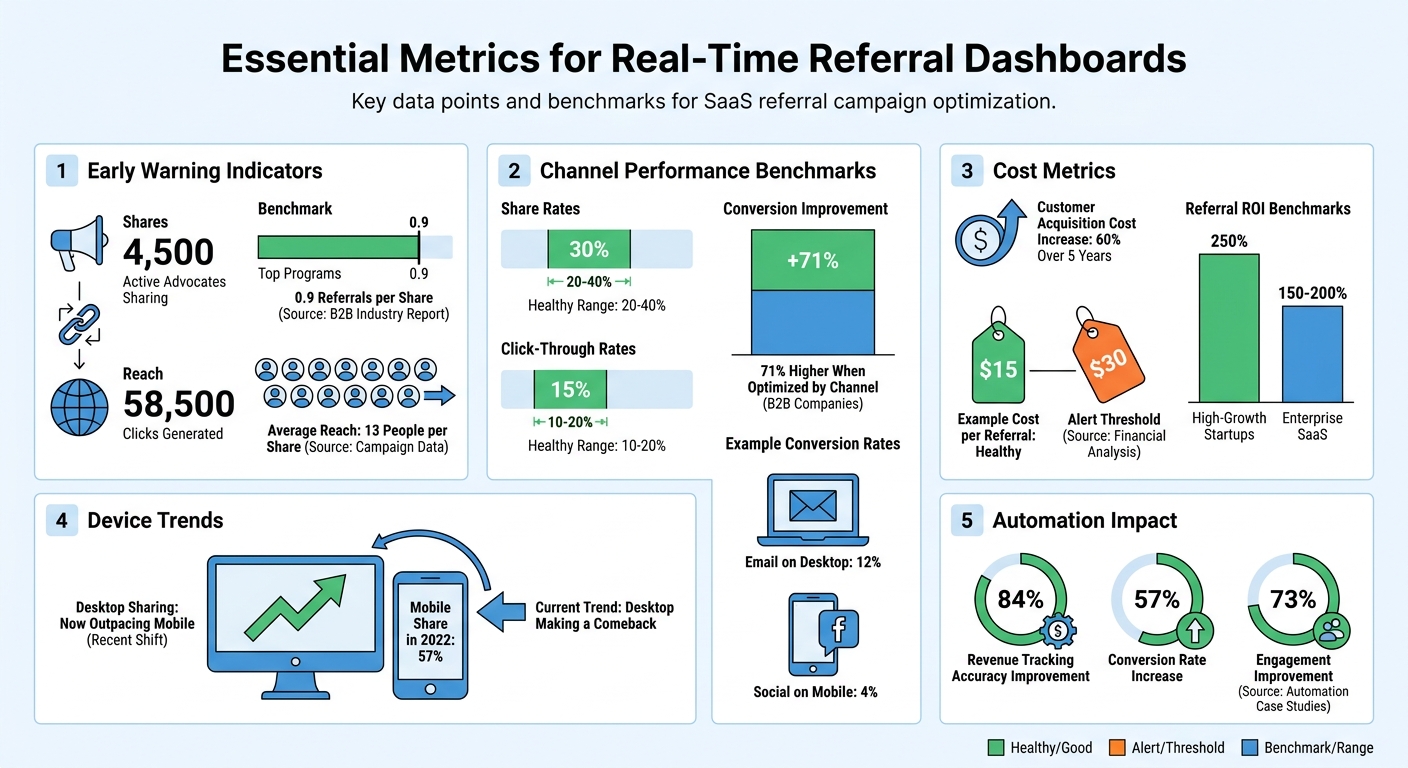
Different channels bring in different audiences, and each audience behaves uniquely. That’s why conversion rates often vary depending on the channel. A low conversion rate for a specific channel might indicate that your messaging isn’t aligned with that audience. Research shows that B2B companies optimizing their campaigns by channel can improve conversion rates by as much as 71%, compared to those running generic campaigns.
It’s also worth experimenting with channel-specific rewards. For instance, cash incentives might resonate with one group, while account credits could appeal more to another. Testing and refining these approaches can help you tailor your efforts for maximum impact.
Cost Per Referral Acquisition
Customer acquisition costs have surged by nearly 60% over the past five years, making it critical to track your cost per referral in real time. If this cost suddenly jumps - say, from $15 to $30 - you’ll want to act right away rather than waiting for a monthly report. Real-time tracking allows you to pause underperforming campaigns before they drain your budget and helps you identify which channels are delivering the best ROI. For example, high-growth startups often see referral ROI of around 250%, while enterprise SaaS companies typically range between 150% and 200%.
Referral Volume Trends and Velocity
Tracking referral volume trends gives you insight into whether your campaign is gaining traction or losing momentum. Top-performing programs generally achieve about 0.9 referrals per share, with each share reaching an average of 13 people. If you notice a sudden drop in daily referrals, it could signal issues like reward fatigue or message saturation.
Pay attention to benchmarks like share rates (20–40%) and click-through rates (10–20%) to catch these problems early. Additionally, recent data shows desktop sharing is making a comeback, so monitoring device-specific performance can help fine-tune your strategy.
How to Visualize Referral Data Effectively
Choosing the right type of chart can make a huge difference in how quickly you spot trends and identify issues. The goal is simple: make patterns obvious so you can act fast. Each chart type offers a unique perspective, helping you avoid information overload while still capturing the key metrics discussed earlier. This makes it easier to fine-tune and optimize your SaaS referral program on the go.
"Look for website referral tracking software that offers data visualization features, such as charts and graphs, to help you easily analyze and interpret your data." - ReferralHero
Different charts serve different purposes, and when paired with the right metrics, they can provide a clearer picture of your campaign's performance.
Line Charts for Tracking Trends
Line charts are ideal for spotting trends over time. They’re great for tracking metrics like conversion rates or cost per referral across specific periods - whether it’s days, weeks, or months. For instance, if your cost per referral jumps from $15 to $30, a line chart will make that spike easy to spot. The same goes for a sudden drop in referrals, like going from 50 per day to just 20. These charts also highlight seasonal shifts or viral moments. For example, if your reach (clicks per share) suddenly surges, it’s a sign that your content is connecting with new audiences.
Heatmaps for Comparing Multiple Dimensions
Heatmaps shine when you need to analyze multiple variables simultaneously. They let you compare things like share sources (e.g., Member Portal vs. Email) against device types (Mobile vs. Desktop) without juggling separate reports. For example, you might discover that email on desktop converts at 12%, while social on mobile lags at just 4%. Insights like these help you focus on the most effective channels. Heatmaps also reveal shifts in user behavior over time. For instance, recent data shows desktop sharing now outpaces mobile in some SaaS industries - a big change from 2022, when mobile accounted for 57% of shares. By tracking these shifts, you can adapt your messaging to stay ahead.
Geographic Maps for Regional Performance
Geographic maps let you see where your referrals are coming from, helping you identify top-performing regions and adjust your strategy accordingly. For example, if conversion rates vary significantly between regions, you might test localized messaging or reallocate your ad budget to areas with better momentum. These maps also highlight differences in bounce rates and conversions, which can point to mismatches in landing pages or offers. Tracking clicks on share links by region gives you a clear view of how well localized campaigns are working. This regional insight adds another layer to your channel-specific metrics, giving you a more complete picture of your campaign’s performance.
"If a whole bunch of your customers are coming from a specific website or source, you can rest assured that the tastemakers are there. Your target audience is hanging on their every word, and if you incentivize that word, you can be sure more leads will follow." - ReferralHero
How to Build and Improve Real-Time Dashboards
To create dashboards that support quicker decision-making, focus on the placement of key metrics. Use an F-pattern layout, which aligns with how users naturally scan content, by placing the most critical KPIs in the top-left quadrant. For example, if your primary focus is the conversion rate, position it prominently in the center, using bold text and high-contrast colors to make it stand out. This kind of visual prioritization minimizes the time spent searching for important information, ensuring you can act on insights immediately. This method builds on proven principles of effective data visualization, enhancing your ability to monitor and optimize referral campaigns with real-time analytics. This is especially effective when launching a viral pre-launch waiting list to build early momentum.
Add Interactive Features for Better Analysis
Interactive elements allow users to dig deeper into the data without juggling multiple reports. For instance, date pickers enable quick comparisons, such as evaluating whether last Tuesday’s messaging update improved conversion rates compared to the prior week. Dropdown filters and visible filter indicators help organize data efficiently, while tooltips provide instant explanations for complex terms like "click-through rate" or "attribution window." These features ensure that your dashboard remains clean and user-friendly while offering the flexibility to explore data in greater depth.
Design Dashboards for Clarity
A clear and uncluttered design is key to making real-time insights actionable. Use ample whitespace to separate metrics, avoiding cognitive overload. Skip unnecessary design elements like 3D effects or excessive gridlines, as they can obscure trends. Stick to a consistent color scheme and ensure text meets a contrast ratio of at least 4.5:1 for readability. Pre-selecting common filters, such as "Last 30 Days", makes the dashboard immediately useful upon loading. Additionally, customize access based on user roles - for example, allowing affiliates to view only their performance while administrators access network-wide data. This keeps everyone focused on the metrics that matter most to their responsibilities.
Keep Data Accurate and Current
The effectiveness of real-time dashboards hinges on accurate and up-to-date data. Use tiered refresh rates: update critical KPIs every 5–10 seconds, secondary metrics every 30–60 seconds, and historical data every 1–5 minutes. This approach balances the need for timely insights with server efficiency. Subtle visual cues, like a pulsing icon or fade-in effect, can indicate when data has been refreshed. Automated attribution systems can also boost accuracy - studies show they improve revenue tracking by 84%. For referral tracking, consider using a first-touch attribution model with a 30–90 day cookie window to ensure the original referrer gets credit. Finally, aim for a dashboard load time of under one second and ensure interactivity within two seconds to keep users engaged and satisfied.
Automate Data Integration for Real-Time Insights
Getting real-time insights requires smooth and efficient data integration. Manual data transfers are not only time-consuming but also prone to errors that can skew the results of your referral campaigns. And here's the kicker: data loses its relevance fast - up to 69% by the time it reaches the market. If you're waiting hours for scheduled reports, you're likely missing opportunities. Automation changes the game by delivering continuous updates, ensuring your dashboard reflects the current state of your campaign without any delays.
Connect with Referral Platforms Directly
Today's referral platforms come equipped with APIs designed to pull user data - like reach, referral counts, and converted referrals - in real time. Forget about manually exporting CSV files; these APIs allow for automatic syncing of data. By storing each user's unique ID from your referral platform in your database, you can enable instant API calls to fetch the latest performance metrics.
Take platforms like Prefinery, for example. They offer pre-built integrations that connect directly to analytics tools, saving you the hassle of custom development. Using event-driven data pipelines and automated collection methods - such as timestamping each event and assigning unique IDs - these integrations ensure your dashboard always shows live activity. This eliminates the risk of incomplete or misleading insights.
By automating these processes, you gain a clear, up-to-the-minute view of your campaign performance with minimal manual effort.
Cut Down on Manual Data Work
Automation doesn't just save time; it also improves efficiency. Companies that adopt automated data integration can cut operational costs by 46% and reduce the need for monitoring staff by 67%. This frees up your team to focus on more strategic tasks, like spotting trends and refining campaigns, instead of getting bogged down in data transfers.
Additionally, automated systems can include velocity monitoring to flag unusual activity - like when a single user generates an abnormally high number of referrals in a short period. This kind of proactive monitoring helps you catch errors or performance issues early, ensuring they don't spiral into bigger problems. With these tools in place, your campaigns stay responsive and effective.
Conclusion
Real-time visualization takes your referral campaigns from uncertain guesses to a viral growth strategy. By keeping an eye on key metrics, you can quickly spot and tweak underperforming tactics. Moving from static reports to live dashboards gives you the agility to make decisions on the fly.
As discussed earlier, automation reduces the need for manual data handling, allowing your team to focus on strategic tasks like analysis and campaign refinement.
The real advantage comes from turning complex data into straightforward, actionable steps. When you can monitor leading indicators like shares and reach in real time, you're not just reacting - you’re anticipating the next move. This forward-thinking approach enables you to:
- Pinpoint your most effective advocates
- Adjust your messaging quickly
- Get the most out of every marketing dollar
With customer acquisition costs rising nearly 60% over the past five years, finding ways to improve efficiency has never been more important.
Prefinery simplifies this process with features like pre-built integrations, detailed analytics, and first-touch attribution. These tools help identify the original referrer who initiated the customer relationship, giving SaaS startups the tools they need to launch campaigns quickly, track performance accurately, and fuel growth - far beyond what basic templates can offer.
FAQs
What refresh rate defines 'real-time' for referral dashboards?
Real-time updates for referral dashboards typically mean refresh rates ranging from every few seconds to about a minute. This enables SaaS businesses to track and optimize their referral campaigns almost instantly. With such frequent updates, they can closely monitor key metrics and make timely adjustments to boost performance.
How can I tell if low performance is due to a channel issue or a landing page issue?
To pinpoint why performance might be slipping, take a close look at these critical metrics:
- Conversion rate: If a channel shows low conversion, the problem might lie with the channel itself. On the other hand, high traffic paired with low conversions could signal an issue with the landing page.
- Share rate and engagement: Strong sharing but weak conversions might point to problems with the landing page or the offer. If sharing is low, it could mean the channel outreach needs some fine-tuning.
Make sure to test and tweak your landing pages regularly to boost results.
How can I prevent bad attribution or fraud from affecting referral metrics?
To keep your referral metrics accurate, it's crucial to use a reliable tracking system. This can include unique referral links, codes, or cookies that help ensure every referral is properly attributed.
Fraud prevention is just as important. Watch out for activities like self-referrals or duplicate entries by monitoring your system regularly. Tools like CRM platforms or payment systems can be integrated to flag anything suspicious, making it easier to maintain the integrity of your data.
By combining precise tracking methods with consistent fraud detection efforts, you can ensure your referral data stays both trustworthy and accurate.