
Referral Marketing Metrics for MRR Growth
Measure conversion, referral CAC, churn, and ROI to track how referrals add and retain MRR.

Justin Britten

If I want referral marketing to grow MRR, I track revenue first, activity second. Shares, clicks, and signups can look busy, but the numbers that matter are conversion rate, referral CAC, referral MRR share, churn by cohort, and ROI.
Here’s the short version:
- Share rate tells me how many users send invites via your viral waitlist
- Conversion rate tells me how many invites turn into paying customers
- Viral coefficient shows whether viral marketing can compound
- Referral CAC shows what each referred customer costs
- Program ROI shows whether the program makes money
- Referral MRR share shows how much monthly revenue comes from referrals
- Churn difference shows whether referred customers stay longer
A simple example makes this clear: if I send 1,000 invites, convert 3.5%, and each new customer pays $50/month, that adds $1,750 in new MRR. But I still need to check churn, payback, and cost. Otherwise, I’m only measuring activity.
What this article covers:
- which referral metrics connect straight to MRR
- how to calculate referral-driven MRR growth
- how to track referral data inside billing and attribution systems
- how to improve share rate, conversion, retention, and payback
The main idea is simple: I don’t judge referrals by how many people shared. I judge them by how much monthly revenue they add and keep.
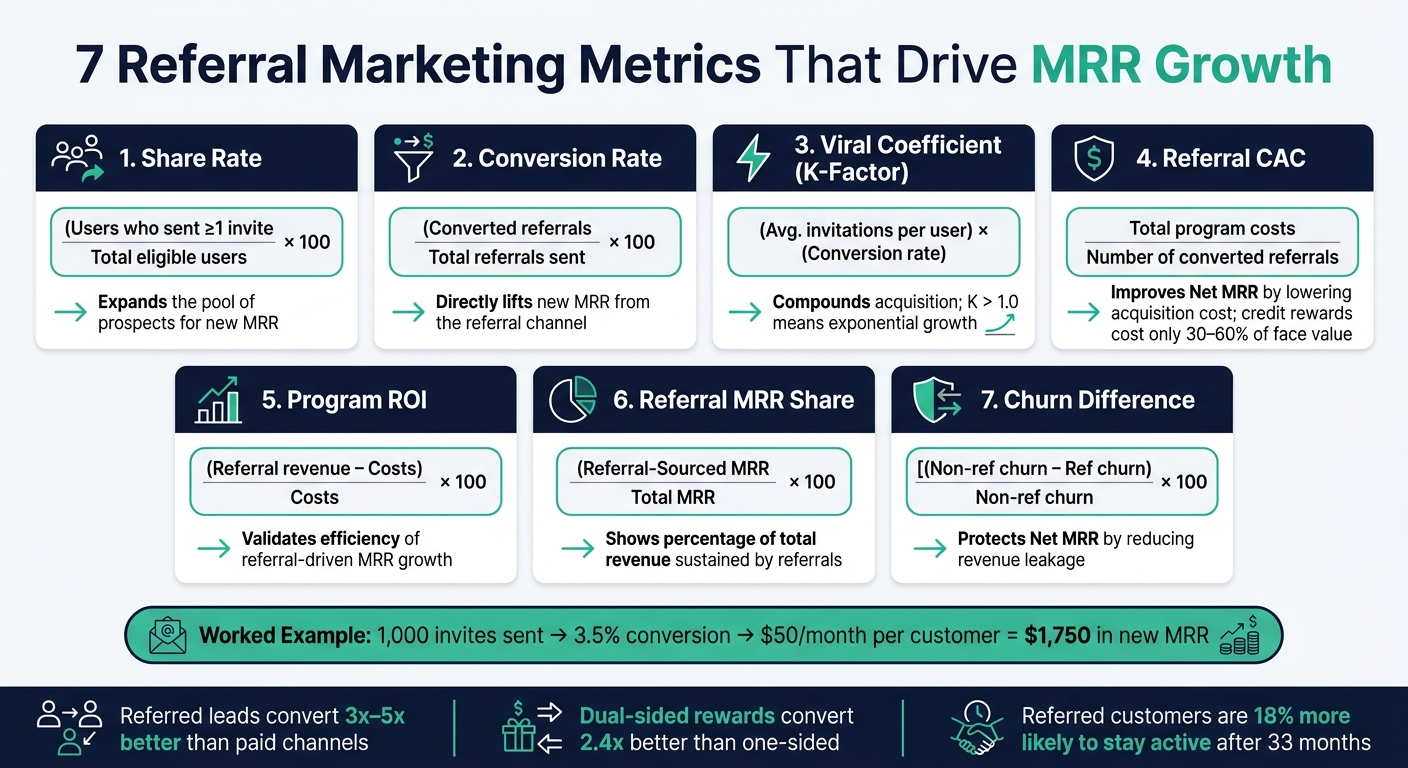
7 Referral Marketing Metrics That Drive MRR Growth
The Referral Metrics That Directly Affect MRR
Not every referral metric matters in the same way.
Some numbers tell you people are clicking, sharing, or showing mild interest. That’s fine. But only a small set of metrics ties straight to revenue. The ones below matter because each one connects to new MRR, net MRR, or your total MRR growth rate in a way you can track.
| Metric | Formula | Effect on MRR |
|---|---|---|
| Share Rate | (Users who sent ≥1 invitation / Total eligible users) × 100 | Expands the pool of prospects for new MRR |
| Conversion Rate | (Converted referrals / Total referrals sent) × 100 | Directly lifts new MRR from the referral channel |
| Viral Coefficient (K) | (Avg. invitations per user) × (Conversion rate) | Compounds acquisition and lifts MRR growth |
| Referral CAC | Total program costs / Number of converted referrals | Improves Net MRR by lowering acquisition cost |
| Program ROI | (Referral revenue − Costs) / Costs × 100 | Validates the efficiency of referral-driven MRR growth |
| Referral MRR Share | (Referral-Sourced MRR / Total MRR) × 100 | Indicates the percentage of total revenue sustained by the referral channel |
| Churn Difference | [(Non-ref churn − Ref churn) / Non-ref churn] × 100 | Protects Net MRR by reducing revenue leakage from referred cohorts |
These are the numbers that decide whether referral activity turns into actual revenue.
Share Rate, Conversion Rate, and Viral Coefficient
Share rate shows what portion of active users actually send a referral. The formula is simple: divide the number of users who sent at least one invite by total eligible users, then multiply by 100.
If share rate is low, the problem usually isn’t the reward. More often, it means people don’t see the referral prompt, or the process feels like a hassle. A small change in timing can help a lot. For example, showing the prompt right after a user hits their first aha moment or completes a successful transaction can lift participation.
Conversion rate is where sharing starts to become revenue. It measures how many sent referrals turn into paying subscribers, which means it has a direct effect on new MRR. It also helps to break conversion rate out by channel, such as email, SMS, or social. That matters because SMS referrals often beat social shares thanks to personal trust.
Then there’s the viral coefficient, or K-factor. This metric combines both reach and conversion. You calculate it by multiplying average invites per user by conversion rate. If your K-factor is above 1.0, each user brings in more than one new user. Even when K is below that mark, a modest K-factor can still stack up over time.
Referral CAC, Program ROI, and Payback Efficiency
Referral CAC is what it costs to get one converted referral. That includes reward payouts, software fees, and operating overhead like engineering time, support tickets, and marketing hours.
There’s an extra detail here that can change the math in your favor. If rewards are credit-based, the actual cost is often only 30% to 60% of face value. In plain English: a $50 credit may not cost you $50. That can make referral CAC look a lot better than it first appears.
Payback period adds another layer. Take referral CAC and divide it by monthly revenue per referred user. That tells you how fast a referred customer pays back what you spent to get them. A shorter payback period gives you more room to put money back into growth.
Program ROI brings all of this up to the channel level. Subtract total costs from referral-sourced revenue, divide by costs, and multiply by 100.
"Executives fund what they can verify. ROI turns referrals from a 'marketing idea' into a measurable growth engine." - Jessica Paluzzi, CMO, Referral Factory
Referral MRR Share, LTV, and Retention by Cohort
Referral MRR share tells you how much of total MRR comes from referrals. It’s the clearest read on how much revenue this channel is carrying.
LTV by referral cohort is where the long-term case gets stronger. Referred customers often show up with more trust and a better fit with the product. That usually leads to lower churn, longer retention, and higher LTV than customers from other channels.
The best way to make that visible is to compare churn between referred and non-referred cohorts at 30, 60, and 90 days. That gives you a clean view of whether referred users stick around longer. And when they do, that churn gap protects net MRR by cutting revenue leakage.
These metrics feed the monthly growth model in the next section.
How to Calculate Referral-Driven MRR Growth
Use the metrics above to separate referral growth from overall business growth.
MRR Growth Rate and Net MRR Growth: The Basics
Two formulas do most of the heavy lifting here.
Overall MRR Growth Rate is:
(Current Total MRR − Last Month Total MRR) / Last Month Total MRR
It shows how fast total MRR is growing from one month to the next.
Net MRR Growth looks at the push and pull inside that growth. It shows whether new MRR and expansion MRR are beating churn and contraction. That matters because a company can post strong top-line MRR growth while still leaking revenue in the background.
Put simply: Net MRR Growth Rate is the number that shows the gap.
Referral MRR Growth Rate and Referral MRR Share
To isolate the referral channel, add up MRR from referred customers only and apply the same growth formula:
((Referral MRR This Month − Referral MRR Last Month) / Referral MRR Last Month) × 100
If referral-sourced MRR goes from $12,000 to $15,000, that’s a 25% monthly growth rate. If overall MRR grew only 10% in that same month, referrals are pulling more than their weight compared with other acquisition sources.
Another metric helps round out the picture: Referral MRR Share.
Referral MRR / Total MRR × 100
When that share goes up, referrals are making up more of total MRR. Pair it with cohort retention data to check whether referred customers are paying back faster, not just signing up faster. This often starts with optimizing viral landing pages to capture referred traffic effectively.
Those inputs feed the monthly attribution model below.
A Simple Monthly Model for Channel Attribution
These are the minimum inputs needed to attribute referral-driven MRR in a clean way.
| Component | Definition |
|---|---|
| Referred Leads | prospects who entered the funnel via a unique referral link |
| Referred Customers | Converted leads who completed their first subscription payment |
| Referral Expansion | Additional MRR from referred customers upgrading their plans |
| Referral Churn | MRR lost when a referred customer cancels |
| Reward Cost | Total monthly spend on incentives (cash, credits, or discounts) |
Track reward cost at economic cost, not face value. That small detail can save you from fuzzy reporting later.
For consistency, stick to one attribution model across reporting periods, such as first-touch, so you don't cherry-pick the numbers that look best. A 30- to 90-day attribution window is a common standard for tying a referral signup to paid MRR conversion.
With clean inputs, the next step is tracking these numbers in your analytics stack.
| Metric | Formula | Best Use Case |
|---|---|---|
| Overall MRR Growth Rate | (Current Total MRR − Last Month Total MRR) / Last Month Total MRR |
Executive reporting, top-line momentum |
| Referral MRR Growth Rate | (Current Referral MRR − Last Month Referral MRR) / Last Month Referral MRR |
Evaluating referral channel efficiency month over month |
| Net MRR Growth Rate | (New MRR + Expansion MRR − Churn MRR − Contraction MRR) / Last Month Total MRR |
Assessing growth sustainability after revenue losses |
Referral Analytics and Tools for SaaS Revenue Teams
Attribution only works when referral, billing, and cost data connect. Once you know how to calculate referral-driven MRR, the next step is simple: make sure your tracking stack collects the data that matters.
What Your Referral System Should Track Beyond Signups
Most referral tools stop at clicks and signups. For revenue teams, that’s not enough. You need four layers of tracking:
| Metric Category | Key Fields to Track | Revenue Impact |
|---|---|---|
| Top of Funnel | Impressions, shares, share click rate | Predicts lead volume |
| Conversion | Invitee click rate, invitee conversion rate | Measures incentive effectiveness |
| Revenue | MRR by source, referral MRR share | Direct contribution to growth |
| Retention | LTV by referral cohort, churn difference | Validates lead quality and long-term ROI |
Revenue teams need both funnel metrics and timing signals to tie referrals back to revenue.
One signal worth watching closely is time to first referral: how long it takes a user to share for the first time after signup. Pair time-to-first-referral with cohort churn, and you can spot the prompt timing and customer segments that drive the best long-term MRR.
Cookie tracking also has a big weak spot. It often misses referrals across browsers and devices. That’s why server-side attribution matters. Store a referral_id in billing metadata or webhooks so attribution holds up even during long sales cycles.
It also helps to compare referral signups in your referral tool against paid conversions in billing. If the gap is more than 20%, that usually points to broken attribution.
How Viral Waitlists Support Early MRR Forecasting
The same idea applies before launch. Waitlists can help forecast early MRR if you track the right signals.
A viral waitlist tracks invite velocity and waitlist-to-paid conversion. That gives revenue teams an early MRR forecast before launch, which is a lot better than guessing from signup counts alone.
Where Prefinery Fits for Referral-Driven MRR Tracking

Not every tool is built for this level of tracking. Some give you basic click data. Others need a heavy API setup just to get answers your team can use. Here’s how the main tool types compare:
| Feature | Basic Referral Tools | Analytics-First Platforms | Viral Waitlist Systems (e.g., Prefinery) |
|---|---|---|---|
| Metric Depth | Surface-level (clicks, signups) | Deep (LTV, churn, cohort trends) | Full funnel (pre-launch leads to MRR) |
| Customization | Rigid templates | API-heavy | No-code + developer-friendly API/webhooks |
| Integration | Limited/pre-built | Complex CRM/data warehouse | Seamless (Zapier, Make, Stripe, CRMs) |
| Best For | Small SMBs | Data-mature B2B teams | SaaS/fintech prelaunch & growth |
Prefinery is built for SaaS and fintech startups that need referral tracking from prelaunch waitlists through paid MRR. Unlike template-based tools, it combines no-code setup, custom rewards, analytics, and Stripe, Zapier, and webhook integrations in a system that can handle launch spikes.
How to Improve Referral Metrics for Net MRR Growth
The metrics above show what the channel is doing. This section is about how to move net MRR by working on timing, friction, conversion, and rewards.
Increase Share Rate and Strengthen the Referral Loop
The goal isn’t more shares for the sake of it. The goal is more referral-sourced MRR.
That starts with timing. Ask people to share after they hit an activation moment, not right after signup. When referral prompts show up inside the product at those moments, participation is 3x higher than with email-only campaigns.
Friction matters too. One-click share buttons and pre-filled messages cut drop-off. And if you want to keep lead quality from slipping, tie rewards to activation or paid conversion milestones instead of raw signups.
Once share rate improves, the next choke point is conversion.
Improve Conversion and Referral Unit Economics
After a referred prospect clicks through, the post-click experience does a lot of the heavy lifting. It shapes how much referral MRR the channel brings in and how fast CAC pays back.
In B2B SaaS, referred leads convert at 3x to 5x the rate of paid channels. That means even small gains in conversion can have a big effect on new MRR and referral CAC.
Reward design feeds into this too. Dual-sided incentives, where both the referrer and the new customer get something, convert 2.4x better than one-sided rewards. If unit economics and retention matter more than cash payouts, account credits are often the better fit.
Put together, these levers help turn referral activity into net MRR growth.
Conclusion: The Referral Metrics That Matter Most for MRR
The referral metrics worth watching most closely are share rate, conversion rate, CAC, and program ROI. Tie each one back to net MRR.
A program can have a high share rate and still lose money if conversion is weak. On the flip side, strong conversion with poor retention can quietly hurt the channel over time. Referred customers are 18% more likely to stay active after 33 months than non-referred customers.
Set a monthly review cadence. Then adjust one lever at a time to optimize your referral program:
- reward structure
- prompt timing
- sharing friction
The referral metrics that matter are the ones that improve MRR growth, retention, and payback.
FAQs
Which referral metric should I prioritize first for MRR growth?
Put Participation Rate first. It tells you if people are actually using your referral program. If no one is sharing, you can't improve conversion or grow through referrals.
Once participation is there, shift your attention to Conversion Rate and Viral Coefficient. Those numbers show how the program turns sharing into growth. Prefinery gives you detailed analytics to track each step in the funnel and spot where revenue growth can improve.
How do I accurately attribute MRR to referrals?
Use a tracking system that connects each user to their referral source across the full customer lifecycle. Unique referral codes, UTM parameters, and persistent session tracking help make sure every signup and purchase is credited to the original referrer.
For better accuracy, connect your referral program to your billing platform and CRM. Compared with manual tracking, Prefinery can automate data flow, cut down on errors, spot fraud, and show how referrals contribute to total MRR in real time.
What is a good referral conversion rate for SaaS?
For SaaS companies, a good referral conversion rate usually falls between 10% and 25%. That said, the right benchmark depends on your business model and where the company is in its growth cycle.
For example, high-growth, product-led startups often land in the 8% to 12% range. Enterprise-focused SaaS companies tend to see lower rates, often around 1.5% to 3%.
That gap makes sense. A self-serve product is easier to share and try on the spot. Enterprise software usually comes with a longer sales cycle, more decision-makers, and more friction.
Tools like Prefinery can help you fine-tune those referral funnels with customization and analytics built around your audience.