
Referral Retention Benchmarks: 2026 Summary
Match referred and non-referred SaaS cohorts, measure D30/D90/12‑month retention, and compare GRR, NRR, LTV, and referral CAC.

Justin Britten
I’d benchmark referrals against your own matched customers - not a blanket SaaS target. Compare referred and non-referred customers at 90 days and 12 months, then check whether retention gains cover referral costs.
A 2011 bank study found referred customers were about 18% more likely to stay, with 16%–25% higher customer value. That’s historical evidence - not a 2026 SaaS target.
Here’s what I’d check before using any reported range:
- The metric: Participation, sharing, and prelaunch signups measure interest, not retention.
- The comparison: Use the same customer age, starting plan, segment, and verified referral rules.
- The outcomes: Track user and account retention, GRR, and NRR separately.
- The costs: Include rewards, software and automation, labor, support, and fraud losses when comparing gross-profit LTV, CAC, and payback.
- The limits: Report cohort sizes, follow-up periods, and uncertainty. Keep relative changes separate from percentage-point changes.
My bottom line: <u>higher retention doesn’t prove referrals caused the gain - or that the program pays for itself.</u>
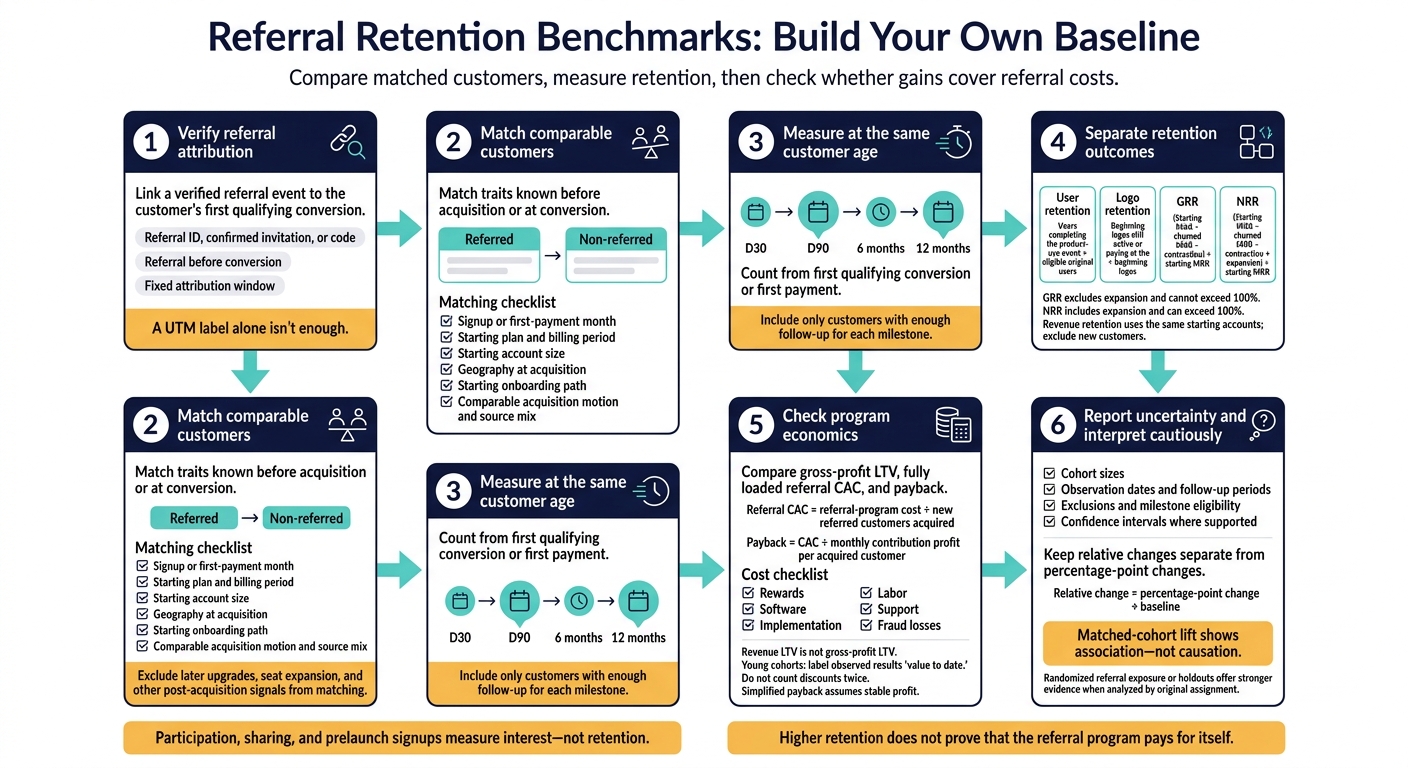
Referral Retention Benchmarks: Build Your Own Baseline
Published Referral Findings and Benchmark Ranges
Published referral studies use different baselines. To make a useful comparison, match the retention windows and metrics.
What the Wharton Research Shows
The study supports higher retention and customer value among referred customers. But without the original cohort setup, the exact lift isn't ready to use as a benchmark. Treat the Wharton-linked findings as directional evidence, not a SaaS benchmark: the lift depends on how the cohort was defined and how long it was tracked.
Referral activity earlier in the funnel matters, but it doesn't prove better retention.
Checking Reported SaaS Referral Ranges
Many published SaaS referral numbers track engagement rather than retention. Before comparing results, check the denominator, reporting window, and whether the metric measures participation or sharing.
The ranges below are engagement benchmarks, not retention benchmarks.
| Company size | Participation rate | Sharing rate |
|---|---|---|
| Startups (0–50 employees) | 5%–15% | 15%–25% |
| Growth-stage (51–200 employees) | 10%–25% | 25%–35% |
| Enterprise (200+ employees) | 15%–30% | 35%–45% |
For vendor-reported results, check what “participation” means: enrollment, an invite sent, or a successful referral. Then check who counts in the denominator - all customers, active users, or offer recipients. These definitions can produce very different rates.
Relative Changes vs. Percentage Points
Percentage-point change and relative change aren't interchangeable. Compare cohorts using the same metric, baseline, and time window. A higher retention rate doesn't mean churn fell by the same relative percentage.
Illustrative example
Metric Baseline New value Relative change Percentage-point change Retention 50.0% 68.5% +37.0% +18.5 points Churn 50.0% 31.5% −37.0% −18.5 points
The relative changes match here only because both starting rates are 50.0%. Use relative change = percentage-point change ÷ baseline. Retention and churn won't mirror each other unless their baselines match.
When comparing referral cohorts on retention and unit economics, apply these definitions and track referred visitors, signups, activation, and retention. Sharing rate alone doesn't predict those outcomes.
SaaS Retention Metrics and Cohort Comparisons
After reviewing the benchmark ranges, compare referred and non-referred customers at the same customer age. Measure retention at D30, D90, 6 months, and 12 months, counting from each customer’s first qualifying conversion or first payment. Keep paid, organic, partner, and sales-assisted cohorts as context - not the main comparison.
| Group | Definition | Attribution boundary |
|---|---|---|
| Referred | A new customer whose first qualifying conversion links to a verified referral event | The referral must occur before conversion and within a fixed attribution window |
| Non-referred | A new customer with no qualifying referral event before conversion | Exclude customers referred later unless the analysis explicitly measures post-acquisition advocacy |
| Paid | A customer acquired through a trackable advertising campaign | Use the campaign’s defined click or impression attribution rule |
| Organic | A customer arriving through direct traffic, unpaid search, content, or untracked word of mouth | Document how direct and unattributed traffic are handled |
| Partner | A customer attributed to an affiliate, reseller, integration, or formal partner | Define whether partner-generated referrals are excluded from customer referral cohorts |
| Sales-assisted | A customer with a qualifying sales interaction before conversion | Define which interaction qualifies |
Retention and Unit Economics
Choose one qualifying product event to define user retention. Report user, logo, and revenue retention separately. For MRR, state whether you convert annual contracts to monthly amounts. GRR excludes expansion and cannot exceed 100%. NRR includes expansion and can exceed 100%.
| Metric | Definition and formula | Denominator and period | Decision supported |
|---|---|---|---|
| User retention | Users completing the product-use event ÷ eligible original users | Users reaching D30, D90, month 6, or month 12; specify the activity window | Do users keep using the product? |
| Logo retention | Beginning logos still active or paying at the milestone ÷ beginning logos | Accounts reaching each customer-age milestone | Do accounts remain customers? |
| GRR | (Starting MRR − churned MRR − contraction) ÷ starting MRR | Same starting accounts over a fixed period | How much existing revenue is lost? |
| NRR | (Starting MRR − churned MRR − contraction + expansion) ÷ starting MRR | Same starting accounts; exclude new customers | Does the installed base grow? |
| Logo churn | Accounts lost ÷ accounts at period start | Monthly, quarterly, or annual period | Where are customer losses concentrated? |
| Revenue churn | Churned and contracted recurring revenue ÷ starting recurring revenue | Same billing period | Are large accounts driving losses? |
| Realized value to date | Cumulative realized gross profit or revenue per retained customer over the observation period | Customers with sufficient follow-up | What has the cohort produced so far? |
| Modeled LTV | Forecast lifetime revenue or gross profit; simplified gross-profit LTV = average recurring revenue per account × gross margin ÷ monthly logo churn | State model assumptions and churn period | What acquisition spending can the business support? |
| Referral CAC | Referral-program cost ÷ new referred customers acquired | Same acquisition cohort and cost scope; include rewards, software, implementation, labor, support, and fraud losses | Are referrals cost-efficient? |
| Referred signup-to-paid conversion | Referred signups becoming paid ÷ qualified referred signups | Fixed D30 or D90 conversion window | Do referred leads become customers? |
| Payback | CAC ÷ monthly contribution profit per acquired customer | Consistent cohort; simplified estimate assumes stable profit | How quickly is acquisition spending recovered? |
| Advocacy rate | Customers completing the defined advocacy action ÷ eligible active customers | Monthly or campaign period | Do customers participate repeatedly? |
Revenue LTV is not gross-profit LTV. Use gross profit when comparing LTV with CAC. For young cohorts, label observed results as value to date, not completed lifetime value. The simplified LTV formula requires stable churn and mature cohorts.
Show how you allocate rewards, software, implementation, labor, support, and fraud losses. Account for discounts, but don’t count them twice - as both lower revenue and acquisition expense.
Before interpreting any lift, lock the attribution rule.
Referral Attribution and Cohort Matching
Link each verified referral event to the customer’s first qualifying conversion through a referral ID, confirmed invitation, or code. A UTM label alone isn’t enough. Lock the conversion definition, attribution window, and attribution model.
Document incentives, fraud screening, self-referrals, duplicate accounts, and the attribution finalization date. Match customers only on traits known before acquisition or at conversion. Leave post-acquisition signals out of matching.
Referral status is the variable you’re comparing. All other matching traits should describe customers before acquisition or at conversion.
| Matching dimension | What to hold comparable | Boundary to document |
|---|---|---|
| Signup or first-payment month | Same acquisition month | One cohort-start event |
| Plan and billing period | Same starting plan; monthly versus annual | No later upgrades |
| Account size | Same employee band or starting account size | No later seat expansion |
| Geography | Comparable markets | Geography at acquisition |
| Onboarding path | Self-serve, guided, or sales-assisted | Starting path only |
| Acquisition source | Comparable acquisition motion and source mix | Report other source differences separately |
Next, check the full referral path - not just the final retention rate.
Referral Funnel and Statistical Checks
Keep referrer activity separate from referred-customer outcomes. Report cohort sizes, observation dates, exclusions, and eligibility for each milestone. Customers without enough follow-up aren’t yet observable at that milestone.
Show confidence intervals where supported. Account for incomplete follow-up rather than counting pending customers as retained. Matching shows association, not causation. Randomized referral exposure or holdouts offer stronger evidence when analyzed by original assignment. These checks help you avoid mistaking early engagement for retention.
| Stage | Numerator ÷ denominator | Reporting window |
|---|---|---|
| Invitations | Verified invitations ÷ eligible active customers | Month or campaign; invitations per customer, not a retention rate |
| Link visits | Unique referral visitors ÷ tracked delivered invitations | Fixed 7–30-day window; document deduplication |
| Signups | Qualified referred signups ÷ unique referral visitors | Fixed attribution window |
| Activation | Referred users completing the value event ÷ referred signups | By D7 or D30 |
| Paid conversion | Referred paying customers ÷ qualified referred signups | By D30 or D90 |
| Renewal | Renewed customers ÷ customers reaching renewal | Contract anniversary or defined billing cycle |
| Expansion | Expansion MRR ÷ starting cohort MRR | Month 6 or month 12 |
| Churn | Lost customers or recurring revenue ÷ starting customers or revenue | Defined billing period |
How to Interpret Referral Results
Even with matched cohorts and corrected attribution, read referral lift with caution: it does not prove the program caused better retention. Referred customers may already differ from other customers before acquisition.
Errors That Overstate Referral Performance
Benchmarks without clear denominators and segments are starting points for investigation - not targets. Mixing SMB and enterprise cohorts can hide segment-level lift.
Measuring only users who saw referral prompts can introduce survivorship bias. Define the eligible population first. Use prompt views only to measure prompt conversion.
Assess retention alongside gross-profit LTV, fully loaded CAC, referral rewards, and payback. More signups or lower CAC alone don't prove success.
Setting Targets from Your Own Data
Once you've checked for bias, set targets using segment-specific baselines rather than broad referral ranges. The reported ranges below apply only after you've isolated comparable SMB or enterprise cohorts and verified the conversion event, denominator, and measurement window.
| Segment | Reported referral conversion rate |
|---|---|
| Enterprise SaaS | 1.5%–3% |
| SMB SaaS | 3%–5% |
Tracking Prelaunch Referrals with Prefinery
Prefinery tracks prelaunch referrals for post-launch cohort analysis. Keep these records separate from retention and LTV measurements until customers activate and you've collected enough follow-up data.
Conclusion: Build Your Referral Retention Baseline
Before using any benchmark above, check the study’s population, retention definition, and follow-up period. Treat its findings as a guide - not a promise of higher retention.
Build your baseline by matching referred and non-referred cohorts at the same customer age. Track D90 and 12-month retention, GRR, and NRR. Include only cohorts with enough follow-up, and report each cohort’s size and uncertainty.
With retention measured correctly, compare it against referral CAC and payback, using fully loaded program costs. Stronger retention in matched cohorts is a benchmark, not proof that referrals caused the difference.
FAQs
How many customers do I need for a reliable retention benchmark?
The findings don’t set a minimum customer count. Instead, they focus on consistent tracking, clear definitions of active users, and cohort analysis over periods such as 30, 90, or 180 days.
Prefinery’s segmentable analytics help you spot engagement peaks and trends within your user base. This lets you build benchmarks from meaningful data - not arbitrary sample sizes.
How can I test whether referrals actually improve retention?
Compare referred and non-referred customer groups at the same checkpoints: 30, 60, and 90 days. To calculate retention, divide the number of active customers at the end of each period by the group’s starting size. Higher retention or lower churn among referred customers suggests your program brings in loyal users.
Prefinery automates cohort analysis and connects with your CRM, helping you test which referral incentives keep customers engaged over time.
What retention lift would justify my referral costs?
Referred customers should generate higher long-term returns than customers from paid channels. Average benchmarks show 37% higher retention and 16% to 25% higher lifetime value (LTV) than non-referred customers. Hitting these benchmarks can help offset incentive costs through higher LTV and lower churn.
Use Prefinery’s cohort analytics to compare LTV and churn by referral source. If referred customers fall below your baseline, you may be attracting low-intent users - a sign that your incentives or onboarding need work.